

📊 Mid-Year 2026 Condo Market Update
MLS sales data through June 30, 2026
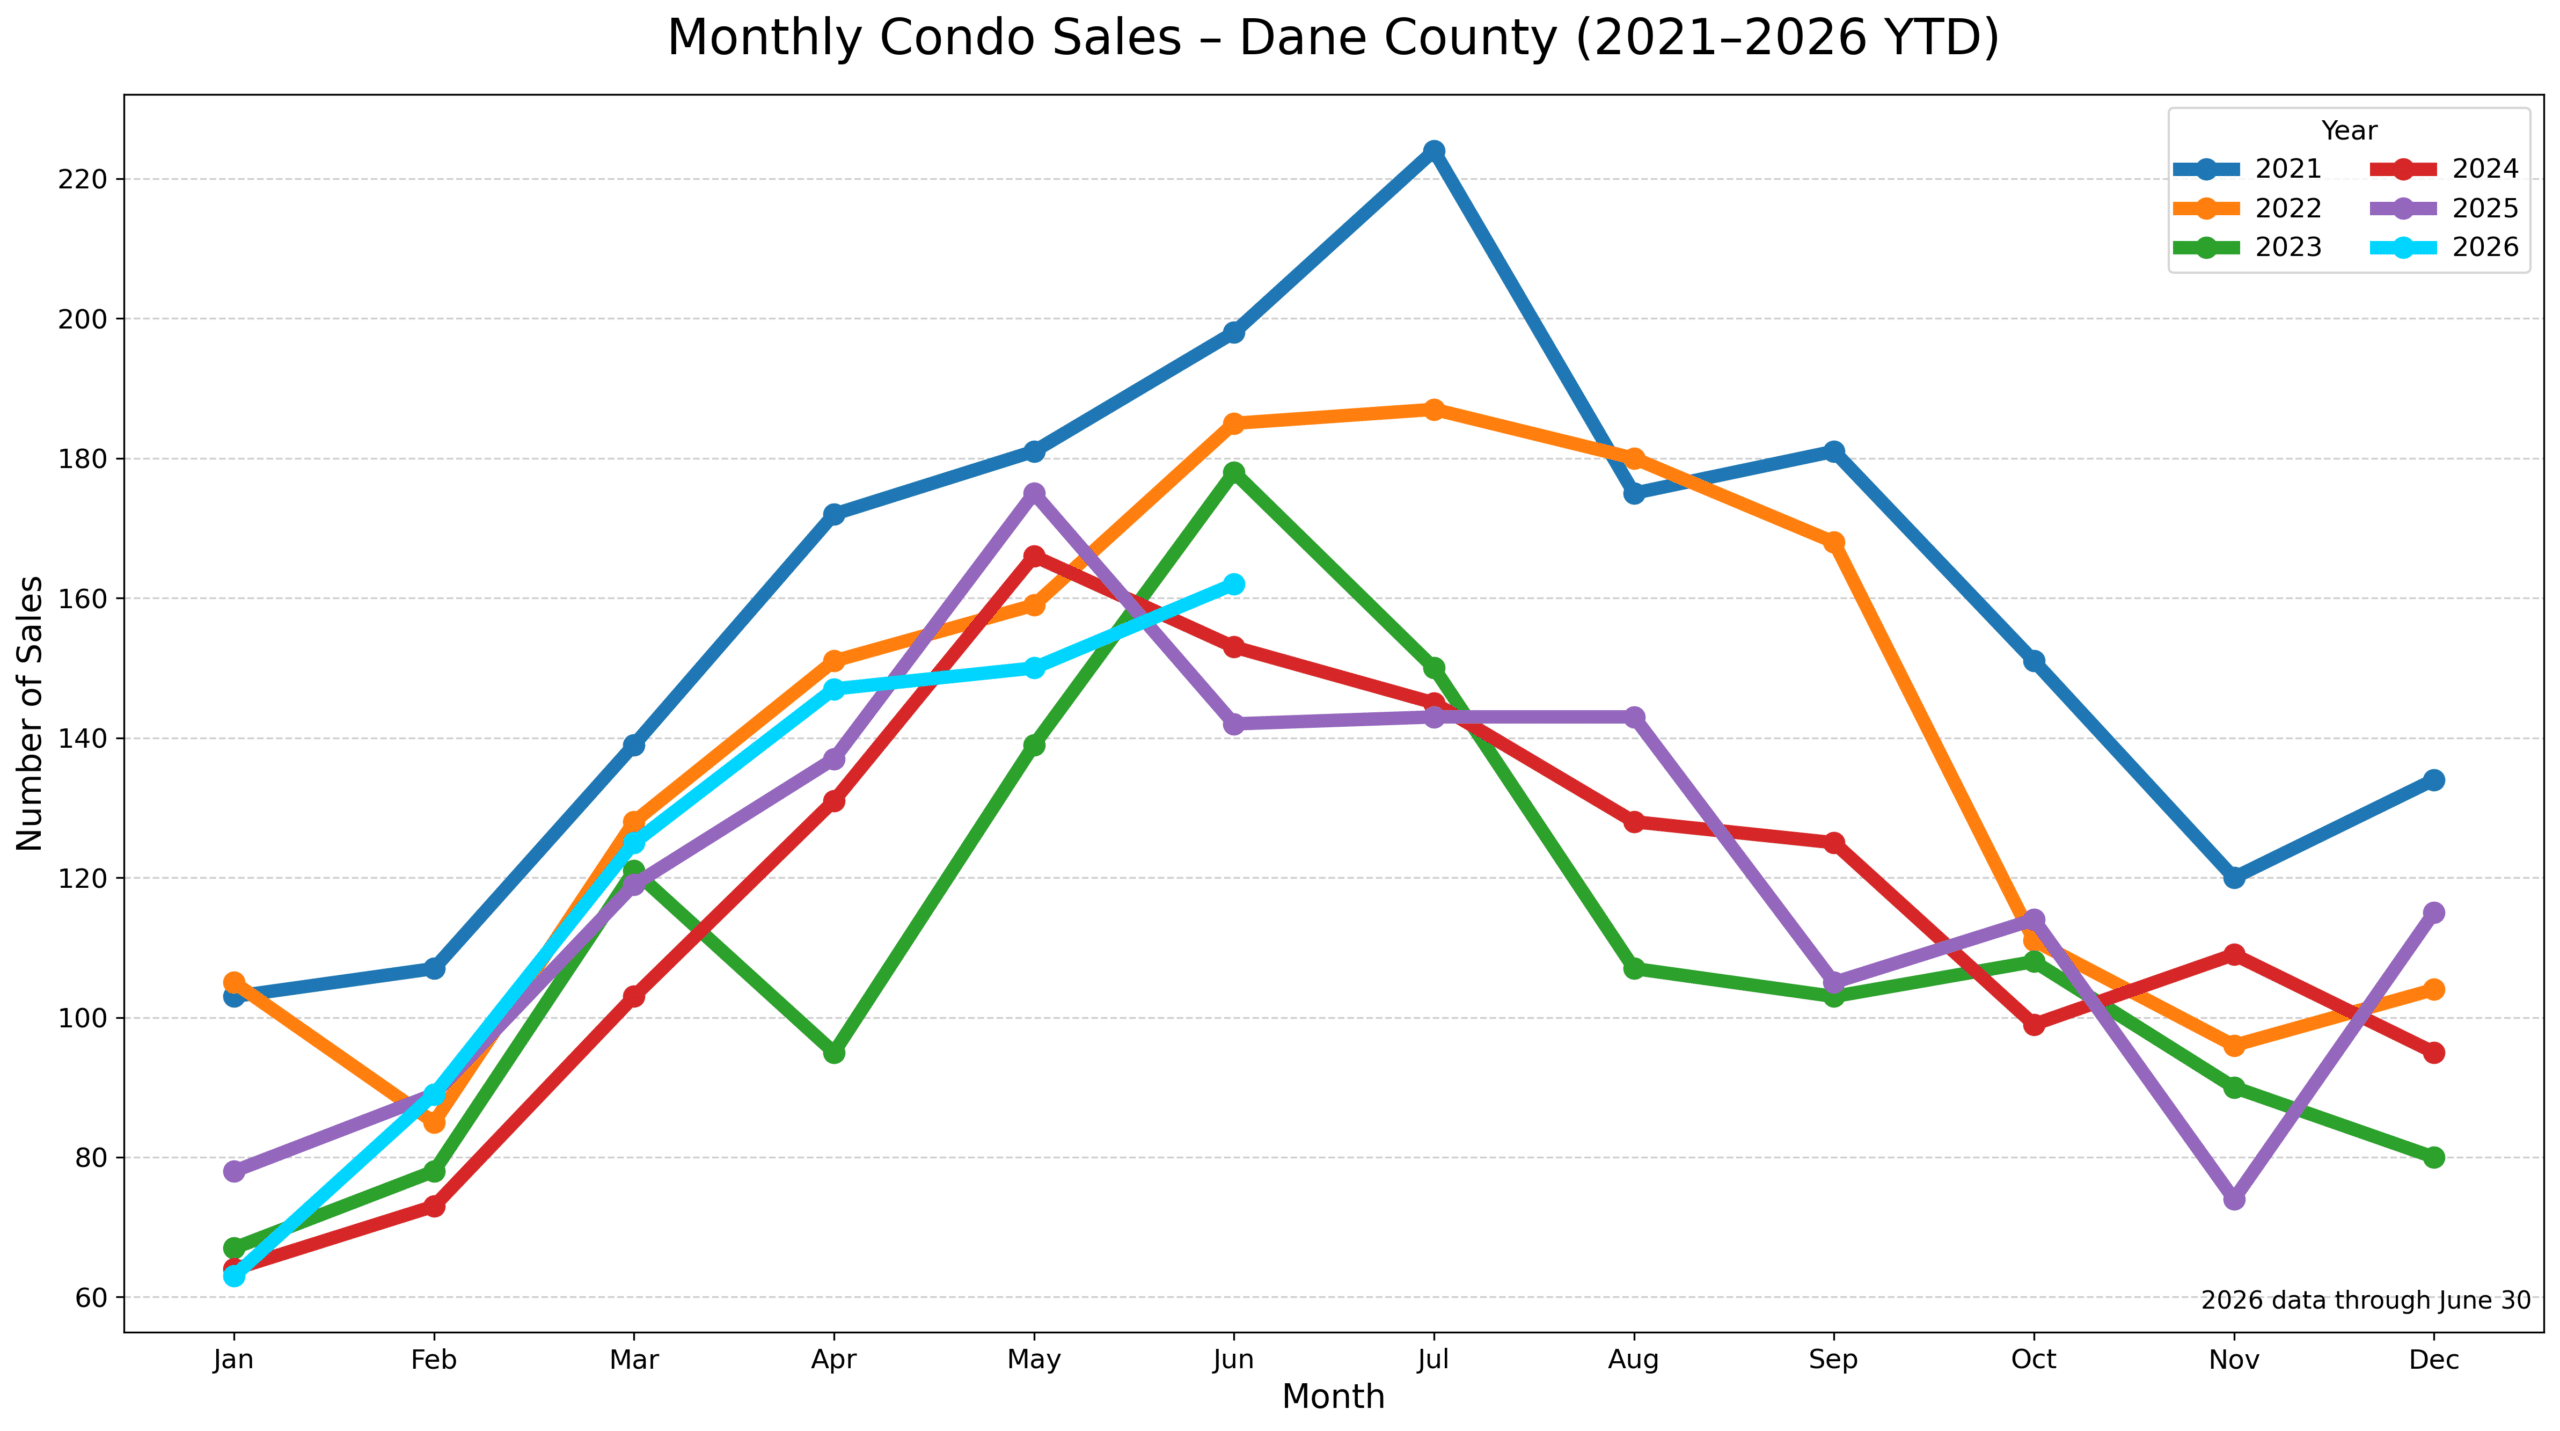
Explore current condo sales trends using verified MLS closing data. The charts below compare 2026 year-to-date activity with prior years, including sales volume, sold prices, days on market and other market indicators.
Looking for reliable condo sales data in Dane County?
You’re in the right place. This page features verified, local data for Madison and Sun Prairie condo markets. Whether you’re buying, selling, or simply tracking trends, this information supports better decisions.
Additionally, we organize all data by month and year, making market shifts easy to follow. Because accuracy matters, only actual MLS closings are included—no estimates or outdated figures.
Moreover, if you’re exploring past performance, you’ll find clear Madison condo sale information with helpful visual breakdowns. Likewise, we provide timely Sun Prairie condo sold data that highlights pricing, volume, and seasonal changes.
As market conditions shift, understanding current Dane County condo sales history helps you prepare for what’s next. Therefore, we update this page frequently to reflect new closings and trends. Plus, comparisons across years give you context for today’s numbers.
So, whether you’re reviewing condo sold info in Madison or planning a move in Sun Prairie, this page offers valuable local insight. And finally, when you’re ready, a trusted Dane County Realtor can help you navigate your next steps with confidence.
📣 DANE COUNTY QUICK HITS OF DATA
📊 Mid-Year 2026 Market Snapshot
⚖️ Prices eased from last year’s highs — but condo sales remained active.
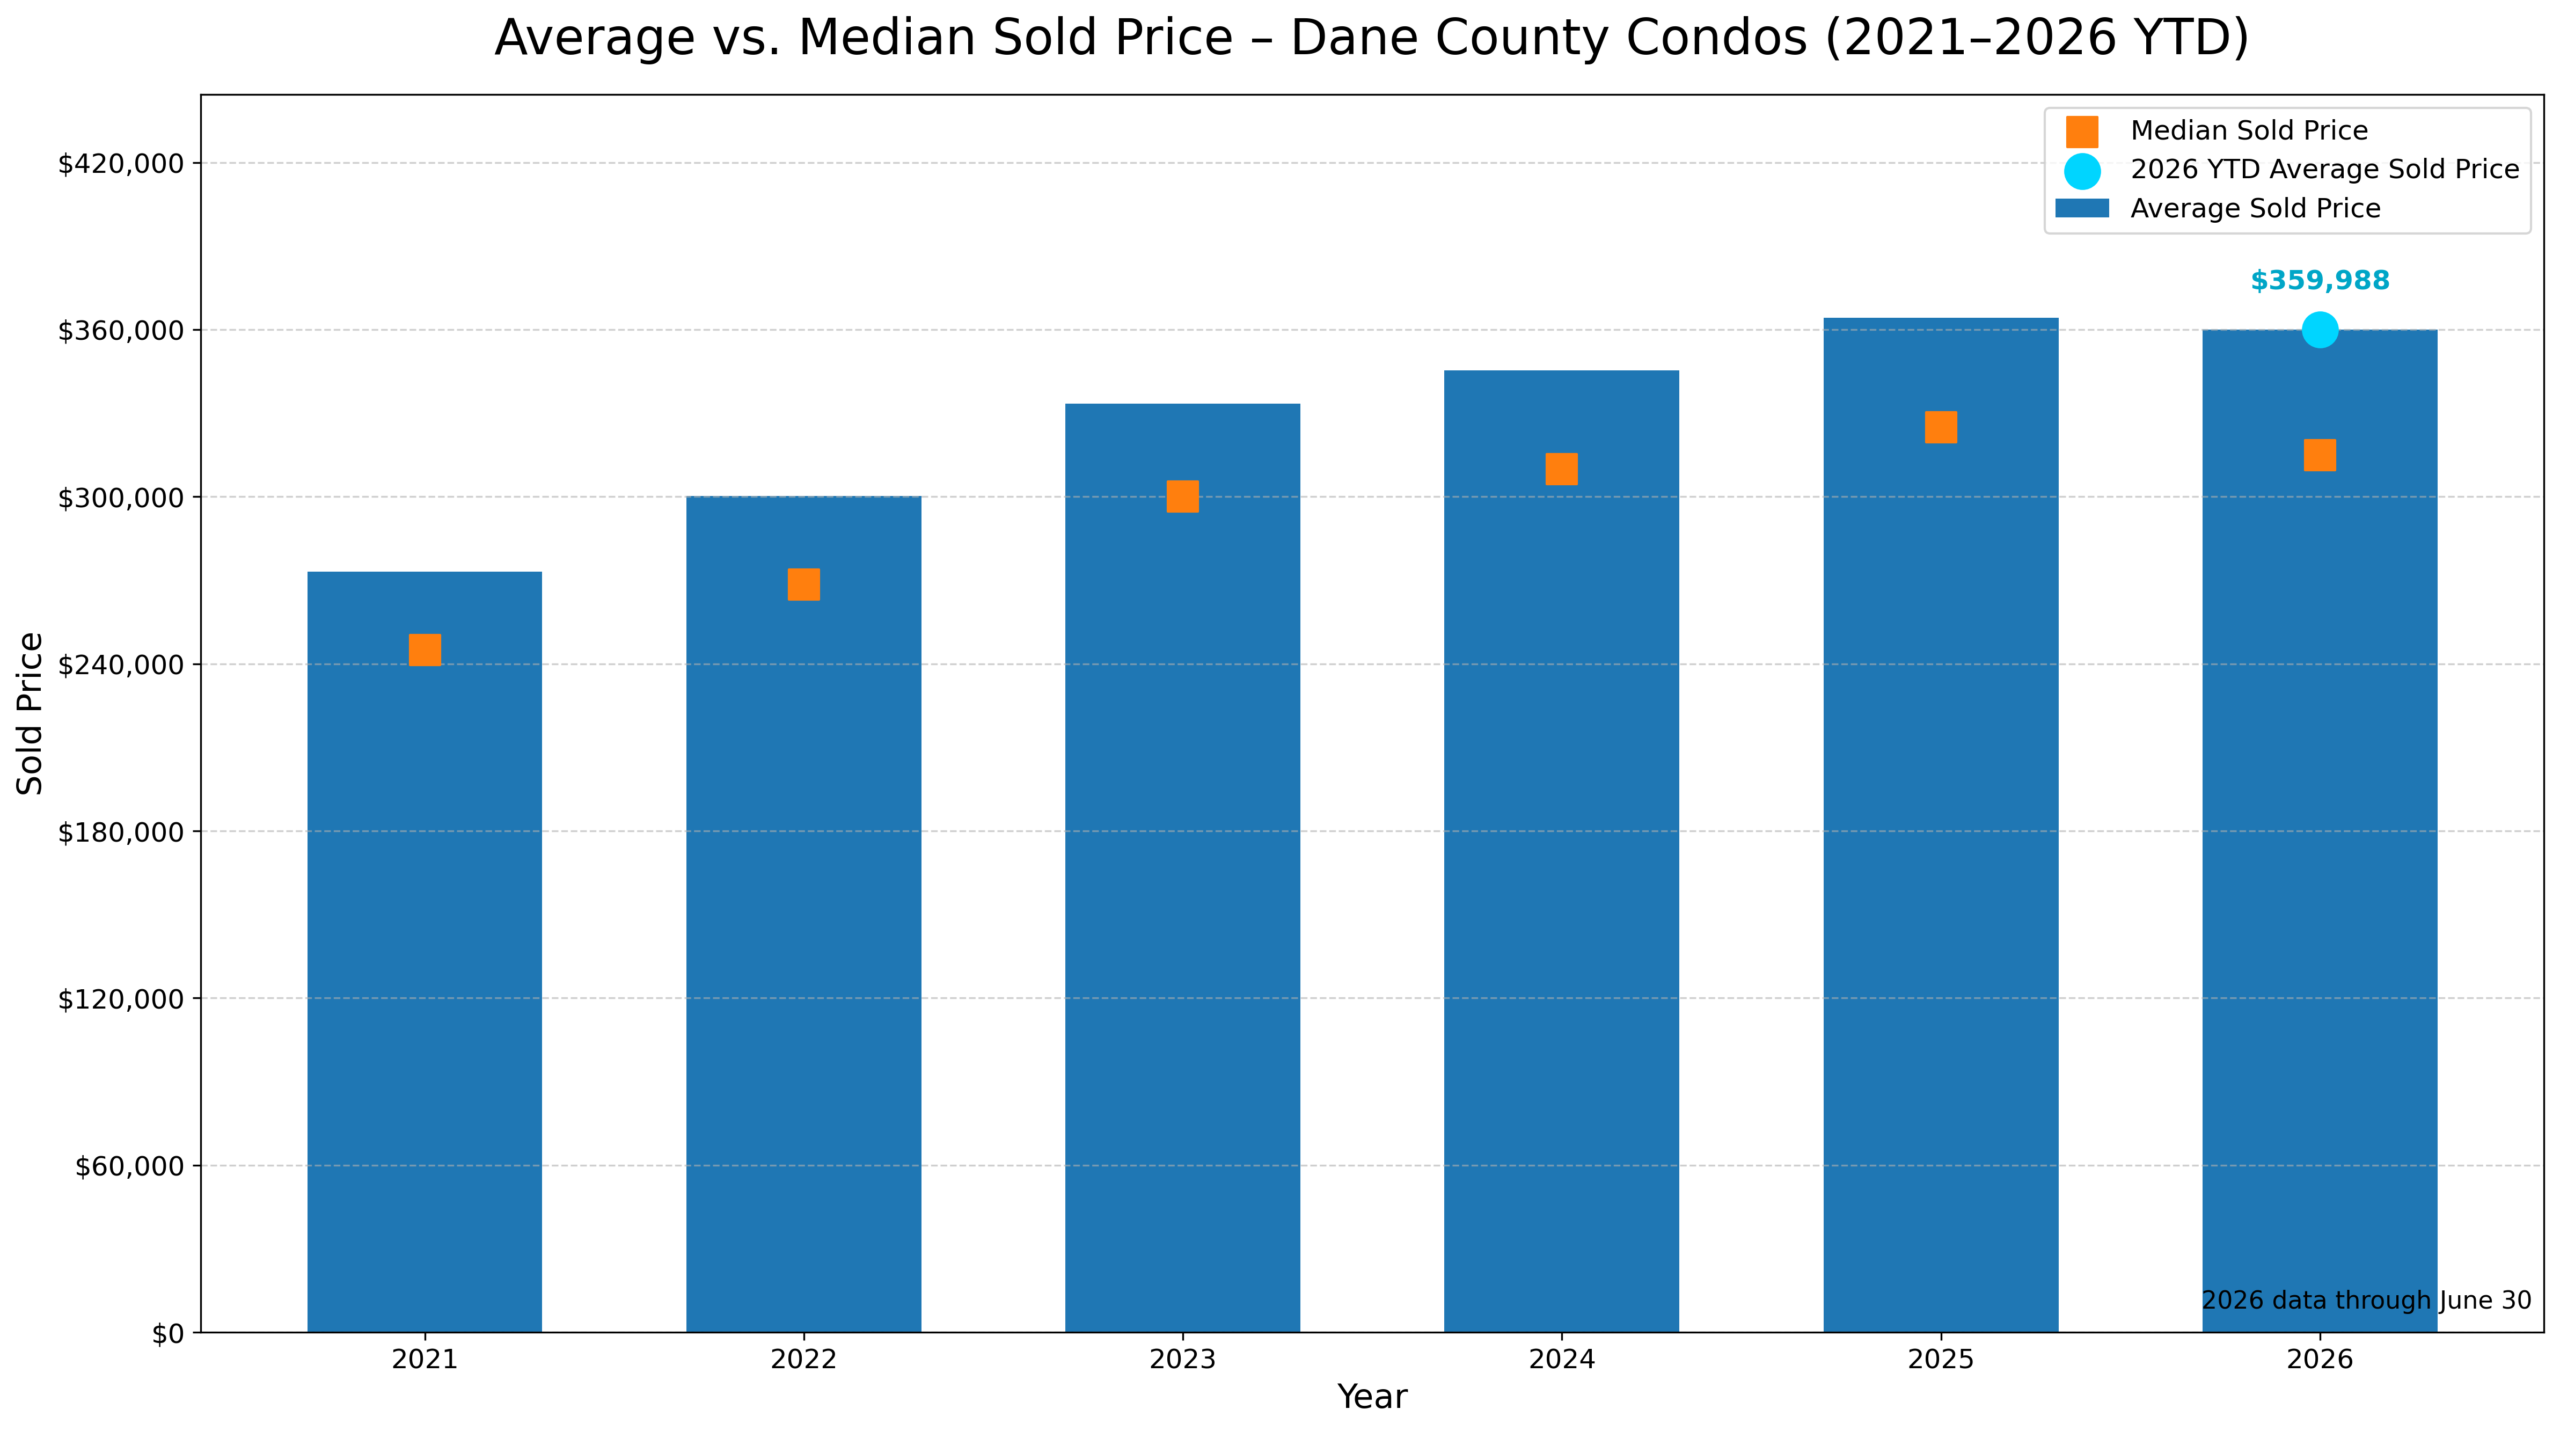
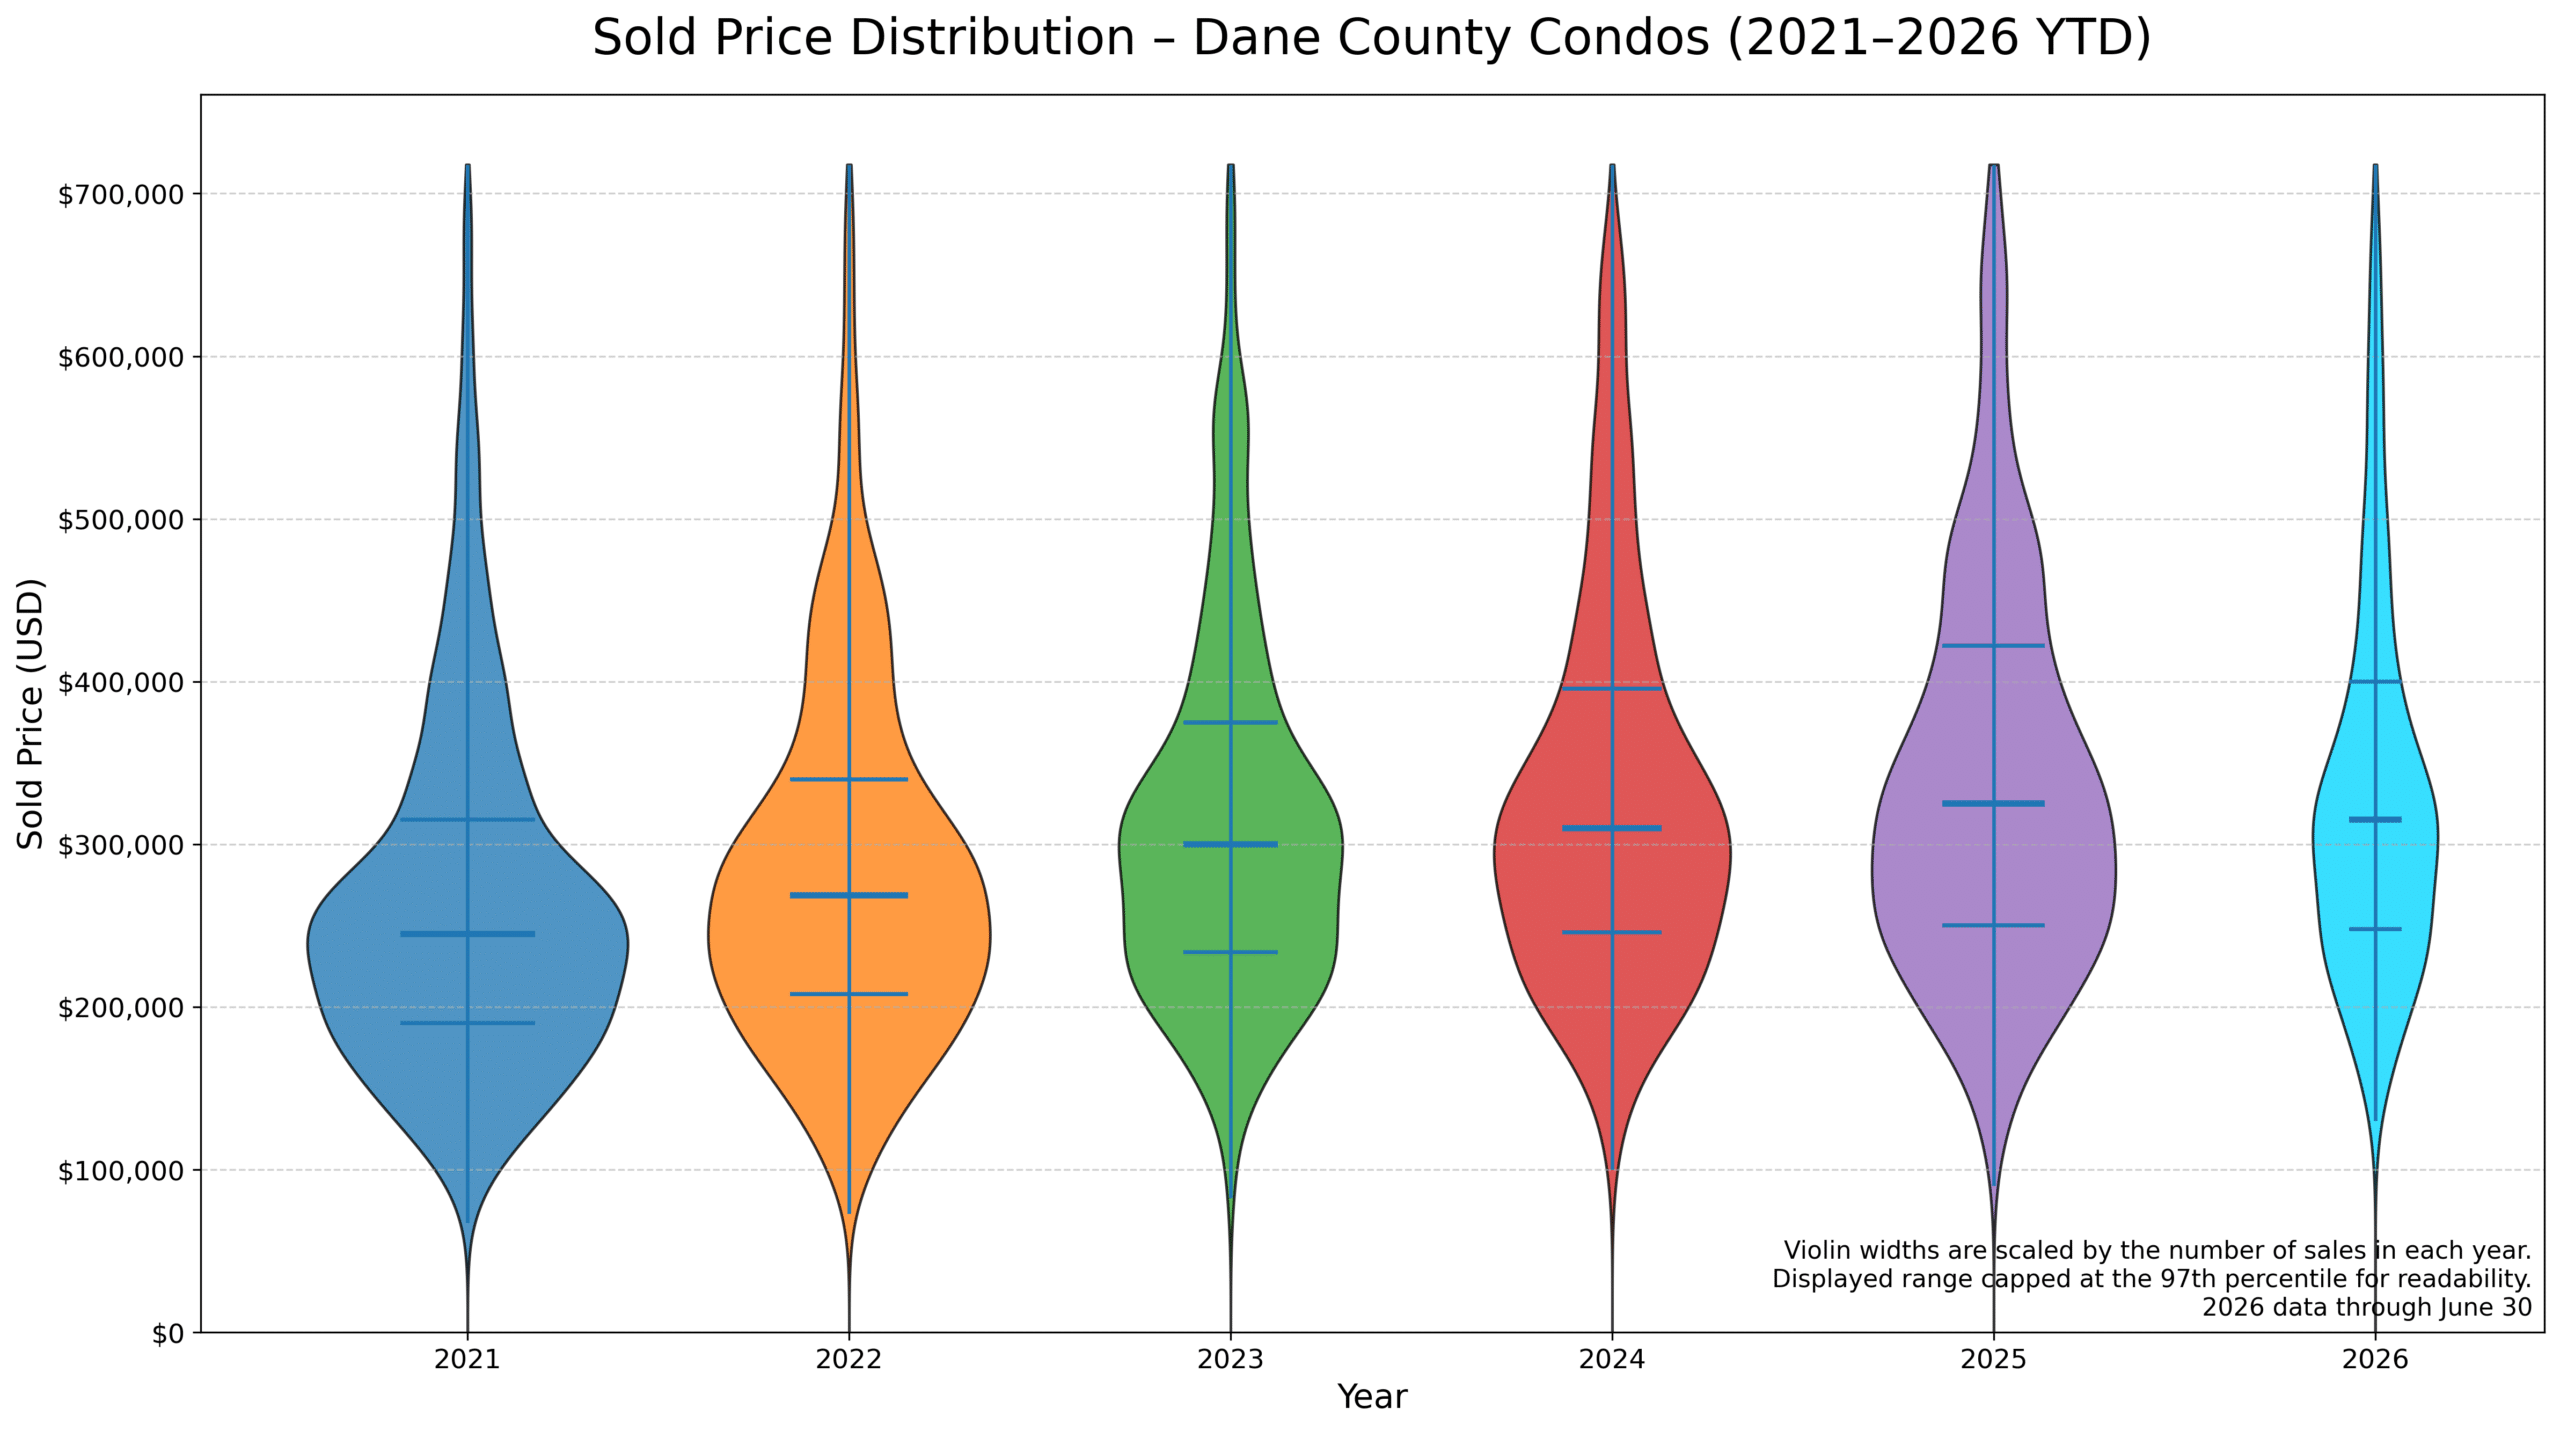
🏷️ Median Sold Price: $315,000
🔻 Down $12,450, or 3.8%, from mid-year 2025
🔺 Still $68,000 higher than mid-year 2021
📈 Average Sold Price: $359,988
🔻 Down $9,815, or 2.7%, from mid-year 2025
🔺 Up more than $86,000 since mid-year 2021
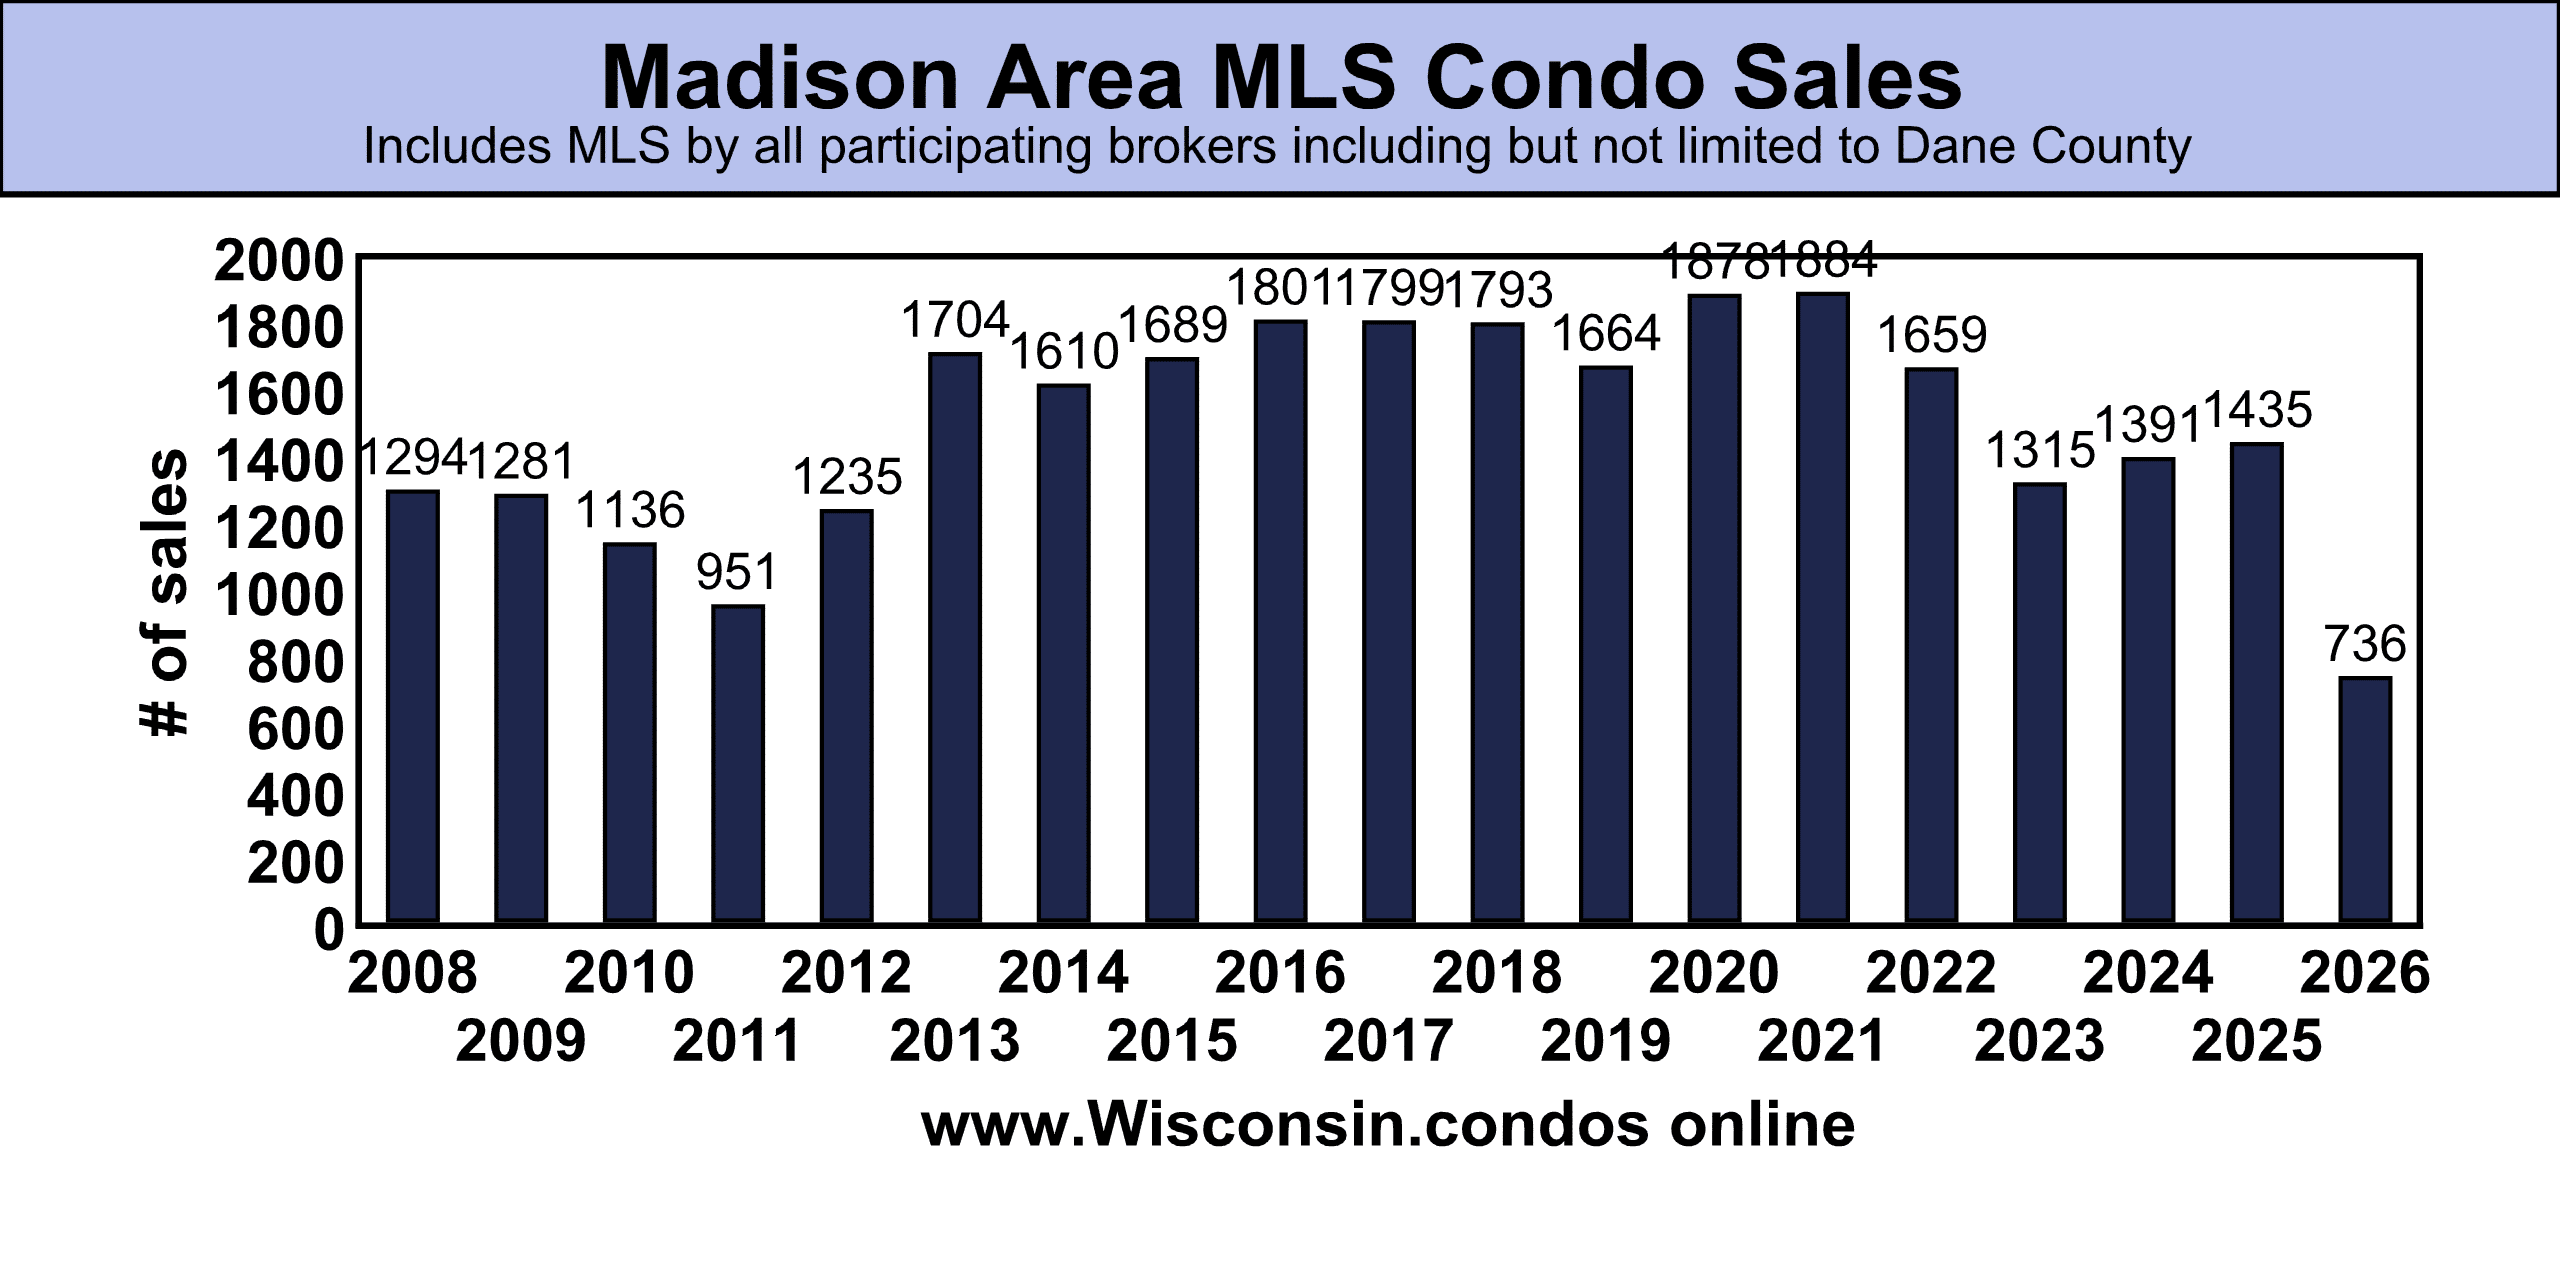
📊 Closings: 736
📍 Just 4 fewer than mid-year 2025
🔺 Higher than the first-half totals recorded in 2023 and 2024
💸 Median List Price: $315,000
📍 Exactly matched the median sold price
➡️ Overall pricing remained closely aligned
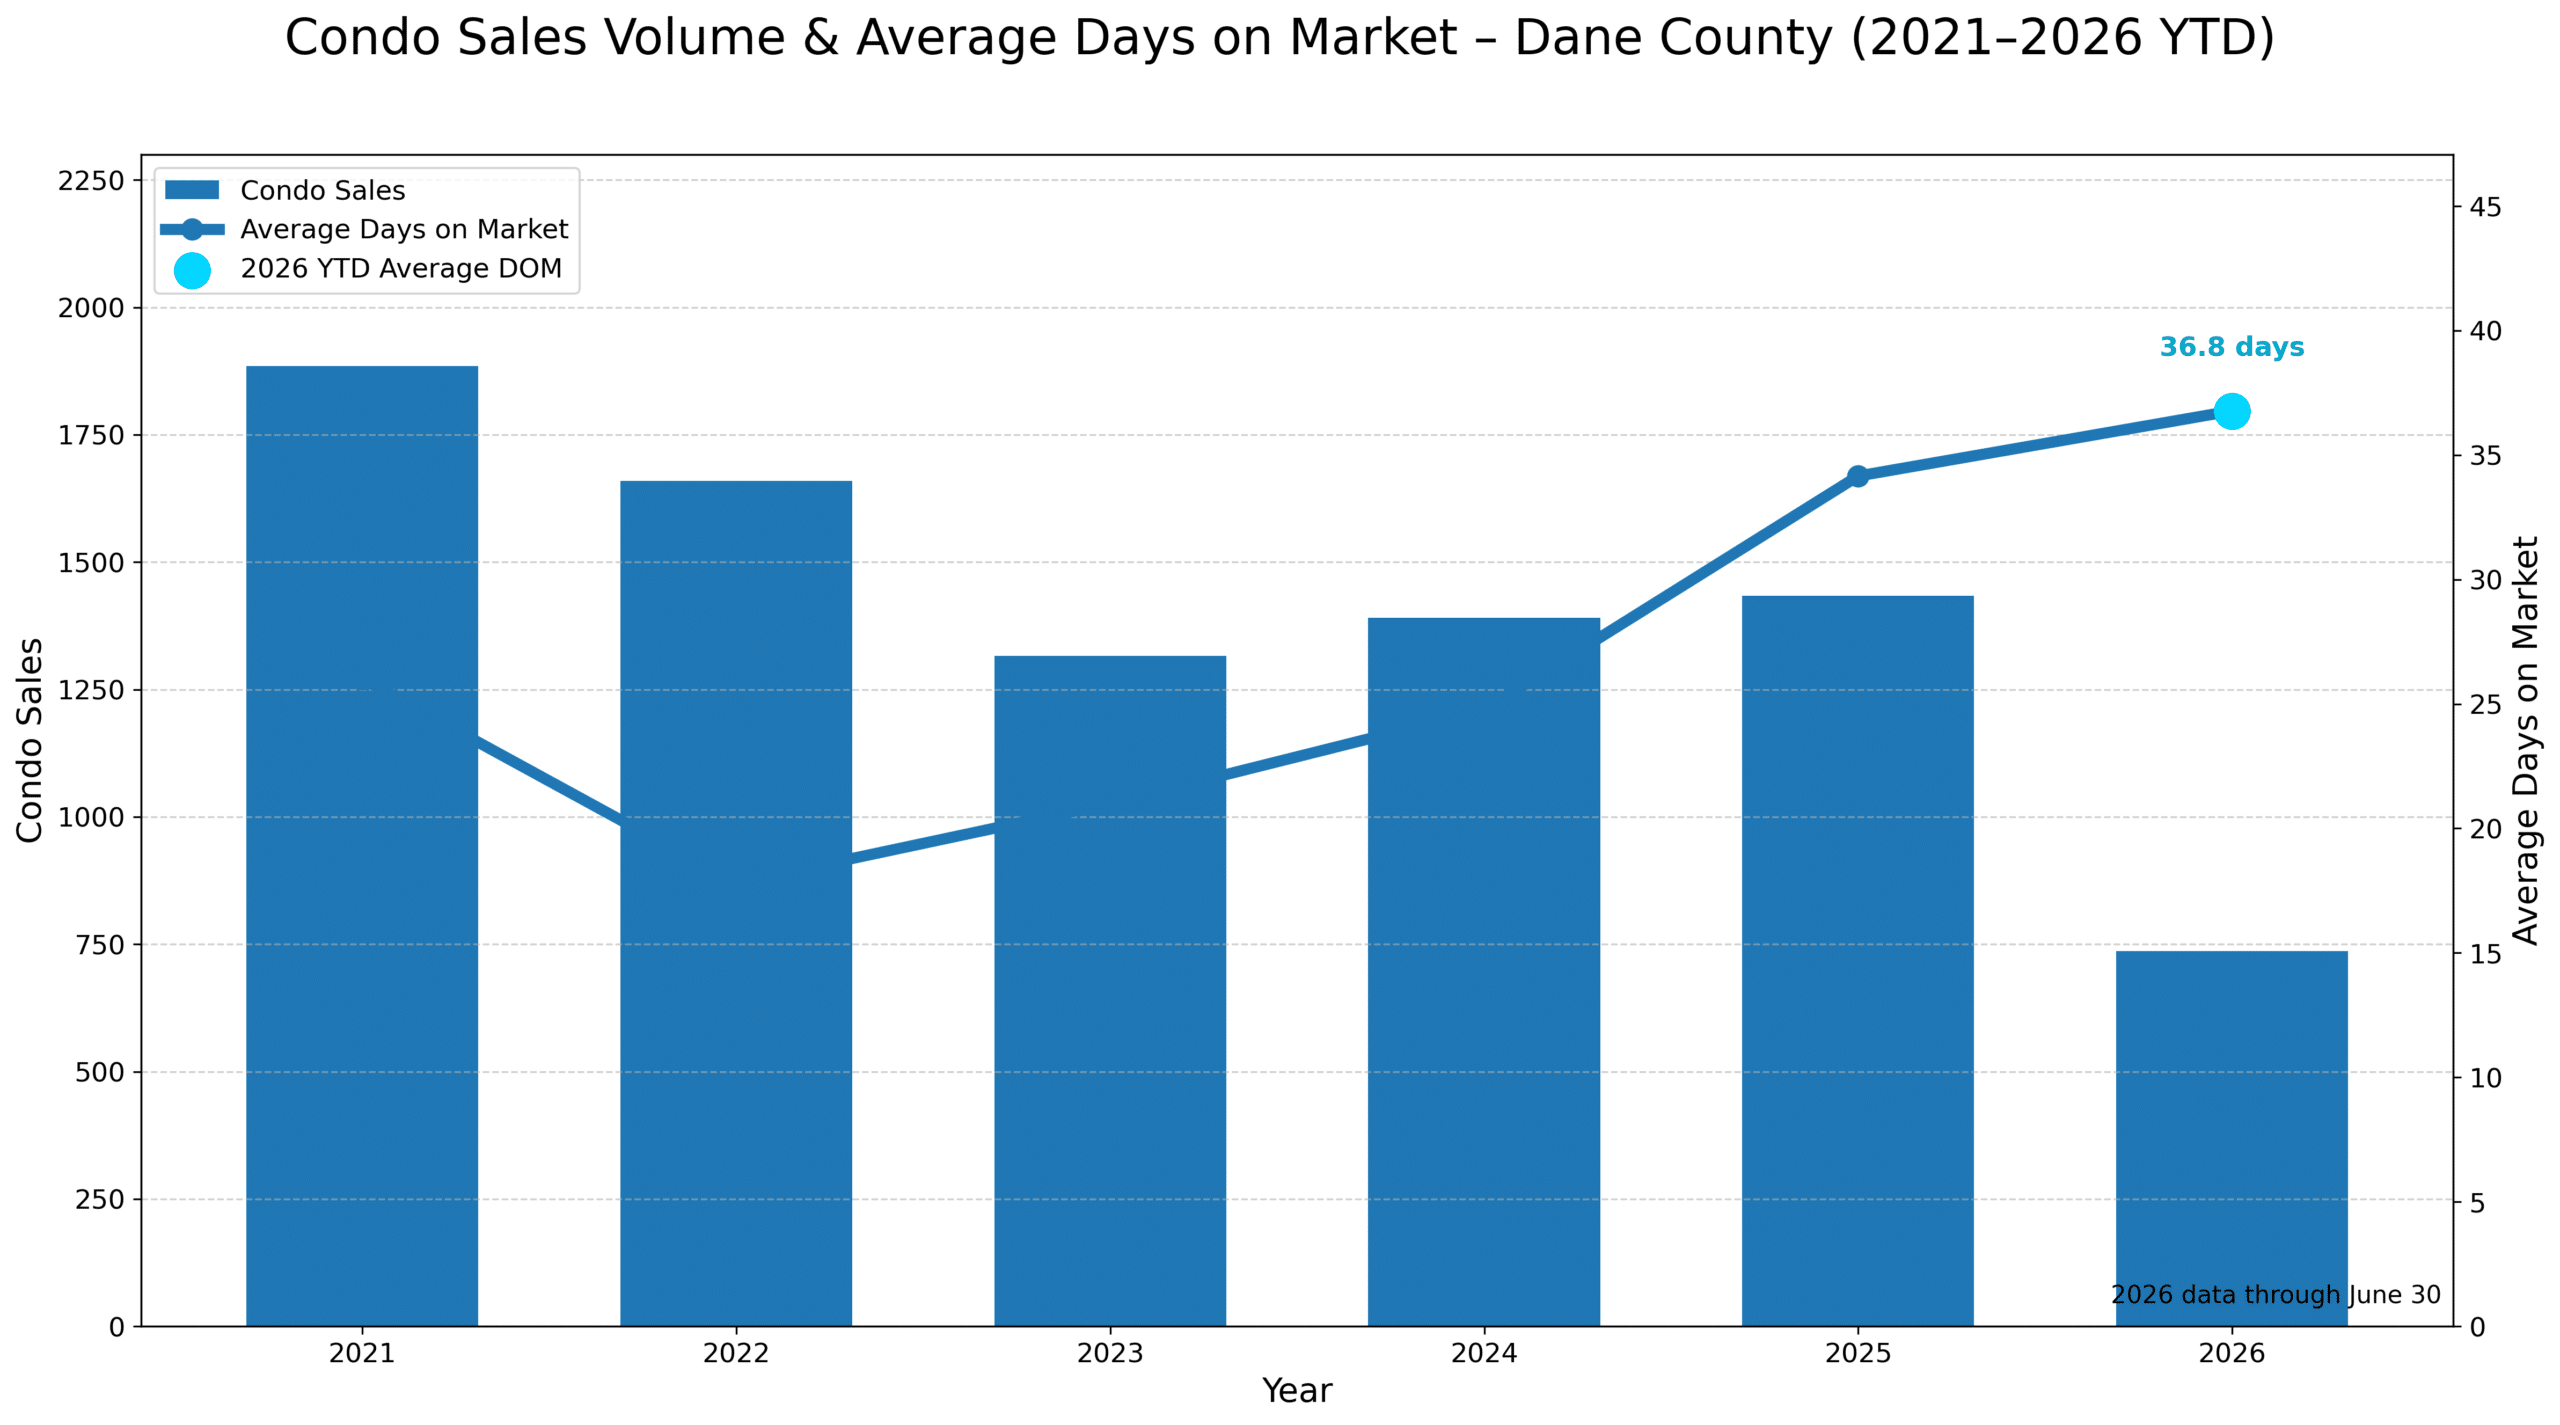
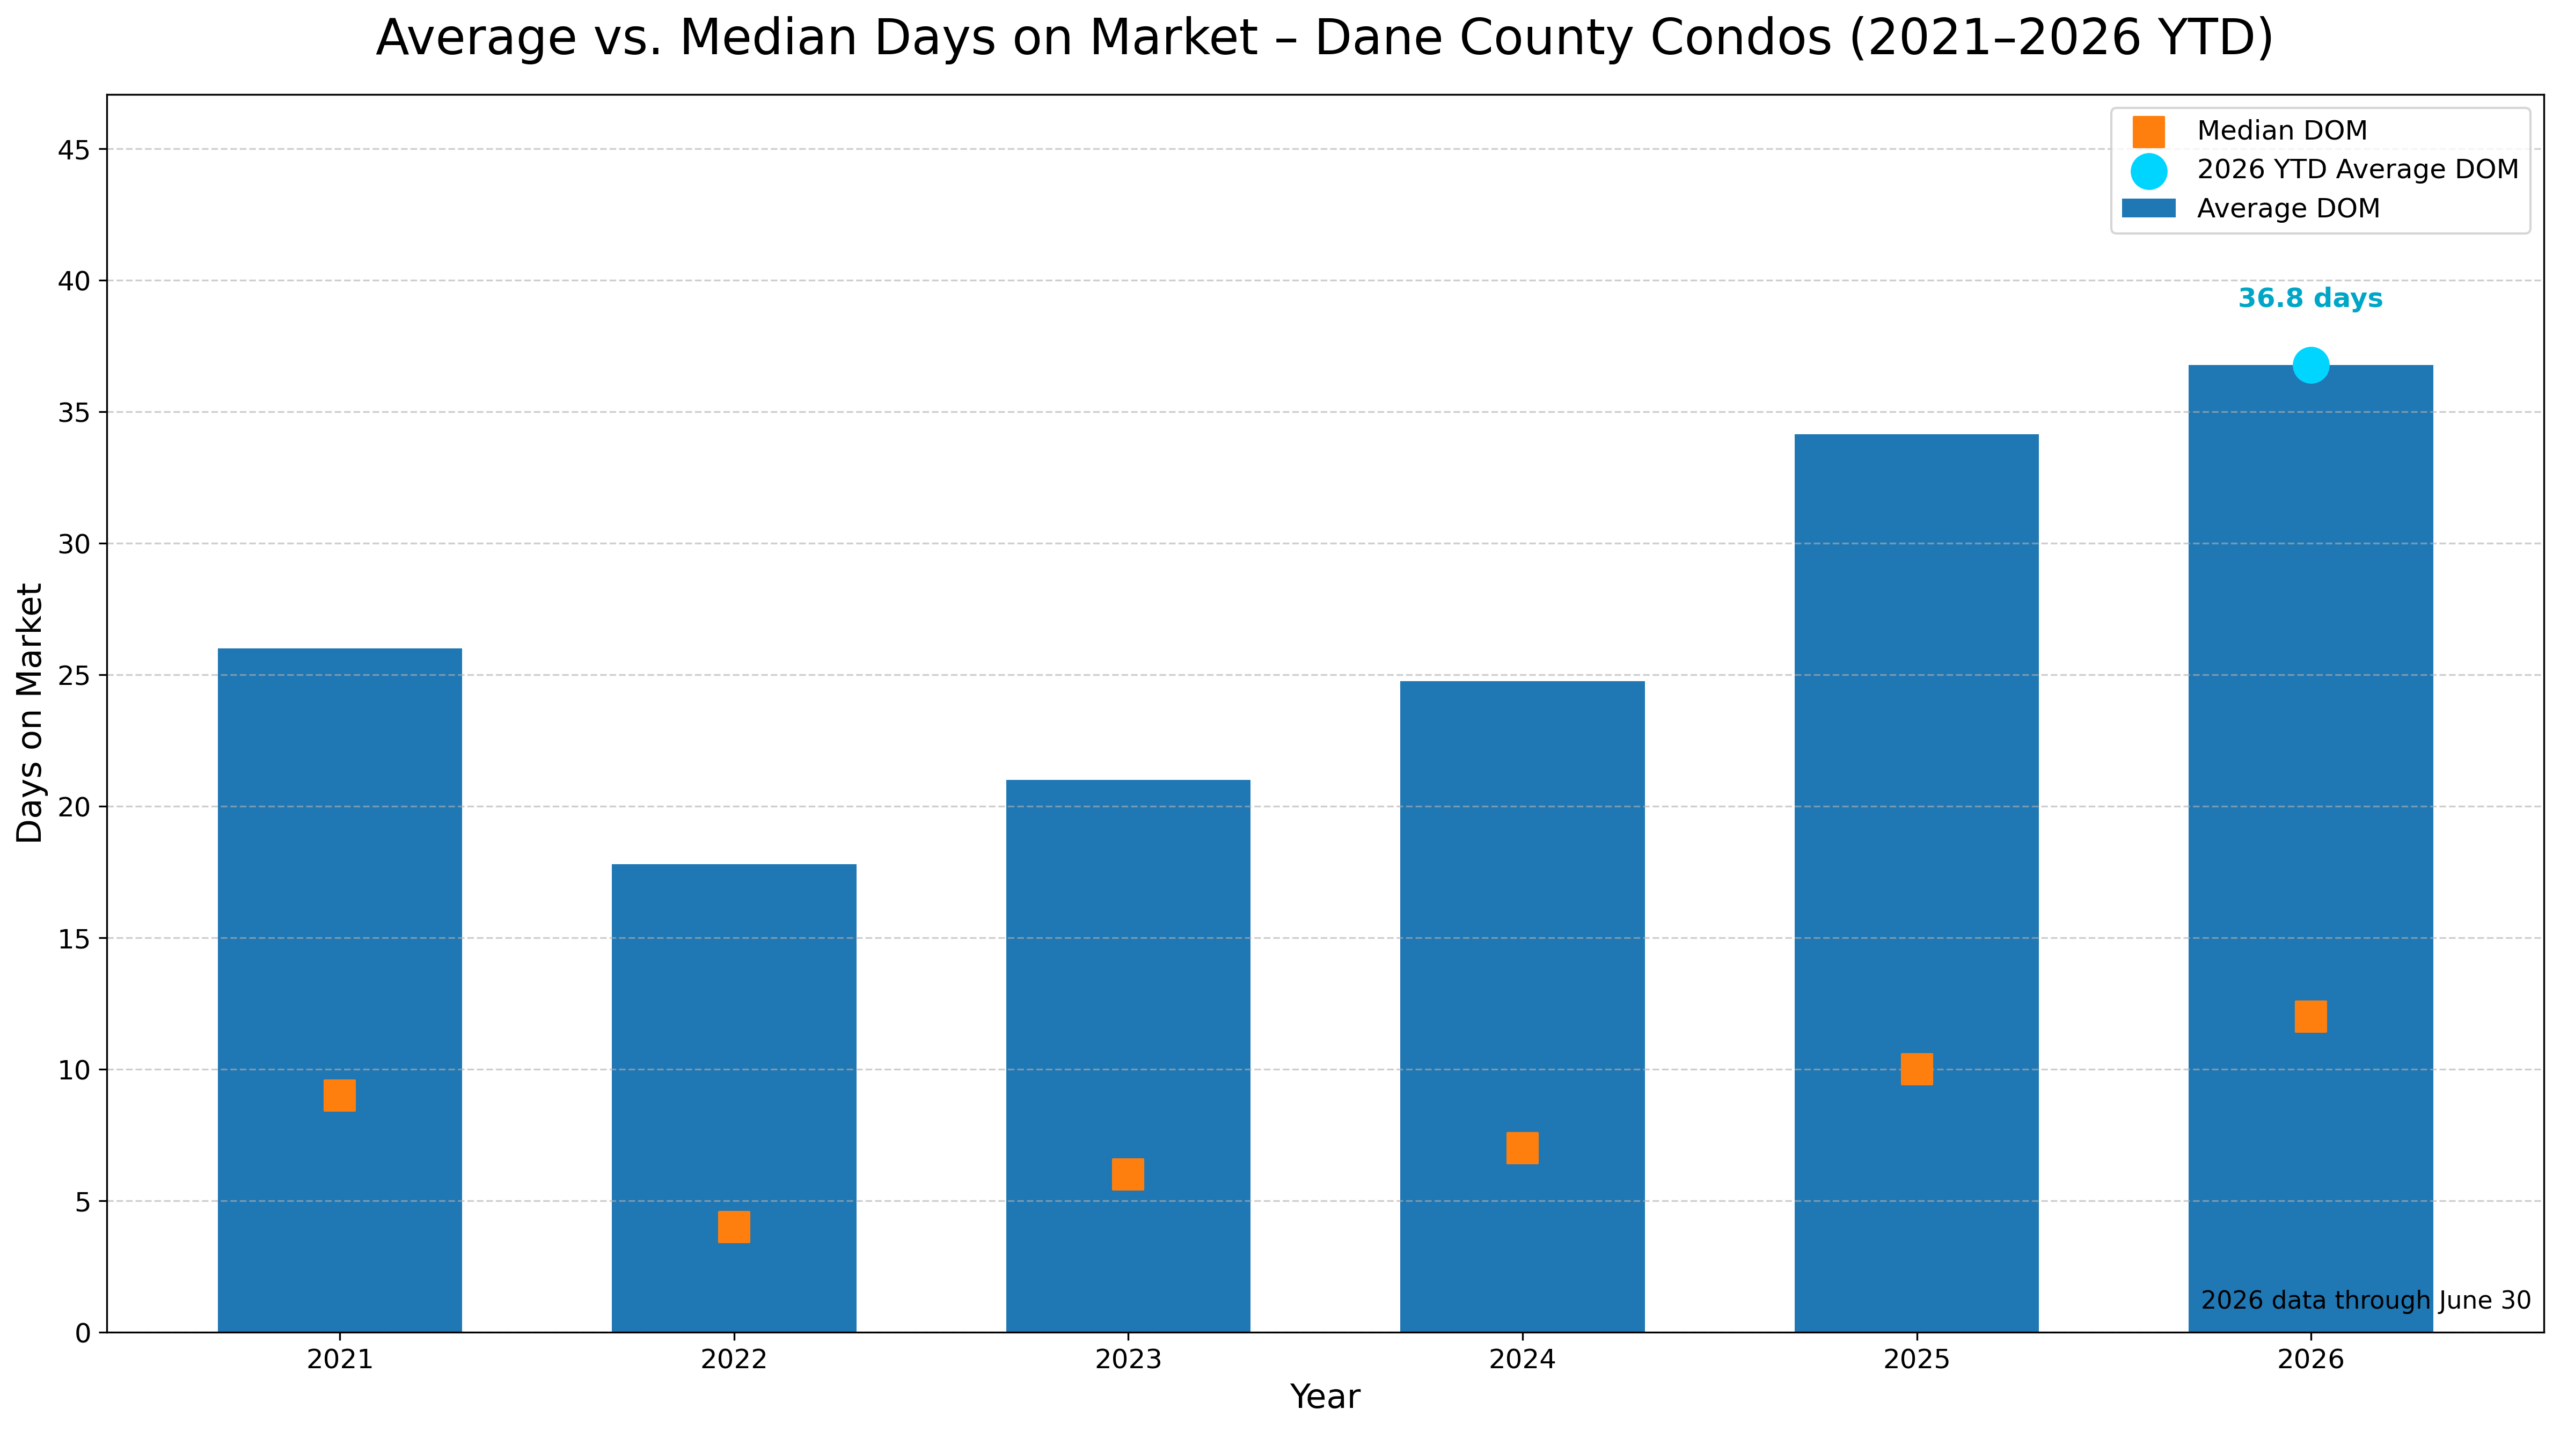
⏳ Median Days on Market: 12 days
⬆️ Up from 8.5 days at mid-year 2025
📍 Still a relatively fast market compared with most Wisconsin counties
📉 Average Days on Market: 36.8 days
➡️ Nearly unchanged from last year’s 36.4-day average
📍 The bigger picture:
Dane County condo prices pulled back modestly from the record levels seen at mid-year 2025, but sales volume barely changed. Of the 736 recorded sales, 322 closed below list price, 202 sold at list price and 212 finished above asking.
Dane County condos cooled slightly in price — without losing much sales momentum.
#DaneCounty #MadisonWI #CondoMarket #MidYearReport #WisconsinCondos #CondoSweetCondo
Cameras During Home Showings: What Wisconsin Buyers and Sellers Should Know
About the Data and Charts
The information shown on this page is based on reported MLS/WIREX sales data. The list price reflects the starting price associated with the property’s most recently reported MLS listing contract. It may not reflect price changes made later under that same listing contract.
Days on market may be calculated differently by each local MLS. Differences in MLS rules, listing histories, relisting practices and data reporting may affect comparisons.
These charts are intended to provide a general overview of market activity and should not be relied upon as a substitute for property-specific research. When a particular sale, price, listing history or market statistic is important to your decision, please ask a licensed real estate agent to verify the underlying MLS information.
Sold Price Distribution Chart
The sold-price distribution chart uses violin shapes to show where sale prices were most concentrated during each year.
- Wider sections indicate a greater concentration of sales within that price range.
- Each violin’s overall width is scaled according to the number of sales reported for that year.
- The visible price range is capped at the 97th percentile so a small number of unusually high sales do not compress the main portion of the chart.
- The internal lines identify the lower quartile, median and upper quartile.
- Bright cyan identifies 2026 year-to-date data through June 30.
Rotate Tablet or Phone for Graph Below Showing Priced Reduced Count for Homes in Dane County
Share this information with friends? or bookmark it for yourself.
Buying or Selling? Contact us at 608-247-5528 for a free, no-commitment, consultation.
Because, “www.Wisconsin.condos. Targeted focus. Better Results.” Ask us how.
Follow our Dane County Facebook Page
This content isn't available right now
When this happens, it’s usually because the owner only shared it with a small group of people, changed who can see it or it’s been deleted.- likes 0
- Shares: 0
- Comments: 0
0 CommentsComment on Facebook
🔔 That video doorbell may be hearing more than buyers realize.
Wisconsin law allows a home seller to use video, and potentially audio, surveillance during a showing or open house. Sellers generally do not have to announce that recording equipment is present.
However, permission to record is not permission to publish.
The law restricts where surveillance may be used and generally prohibits sellers from sharing recordings. Meanwhile, buyers could unintentionally reveal their enthusiasm, negotiating limits, or moving circumstances without realizing they are being heard.
What should Wisconsin buyers, sellers, and real estate agents know before the next showing?
I took a closer look at the law, its limitations, and some practical situations that surveillance cameras may capture.
🔗 Article link in the comments.
wisconsin.condos/real-estate-thoughts-matters/wisconsin-home-showing-surveillance-law/
Have you ever had a security camera capture something unexpected during a home showing?
#wisconsinrealestate #madisonwi #homeselling #homebuying #securitycameras
… See MoreSee Less

Cameras During Home Showings: What Wisconsin Buyers and Sellers Should Know
wisconsin.condos
Wisconsin condo financing rules changed in 2026. See what Fannie Mae and Freddie Mac updates mean for condo buyers, sellers and associations.0 CommentsComment on Facebook
One number that jumped out at me: Wisconsin at 7%.
That’s the share of mortgages that were FHA as of Q2 2025, according to New York Fed data this puts Wisconsin among the lowest states shown on this map.
Quite a contrast with parts of the South, where FHA makes up 15%–22% of mortgages.
📊 Source: New York Fed Consumer Credit Panel / Equifax
Map: Lance Lambert / ResiClub
… See MoreSee Less

0 CommentsComment on Facebook