

📊 Mid-Year 2026 Condo Market Update
MLS sales data through June 30, 2026
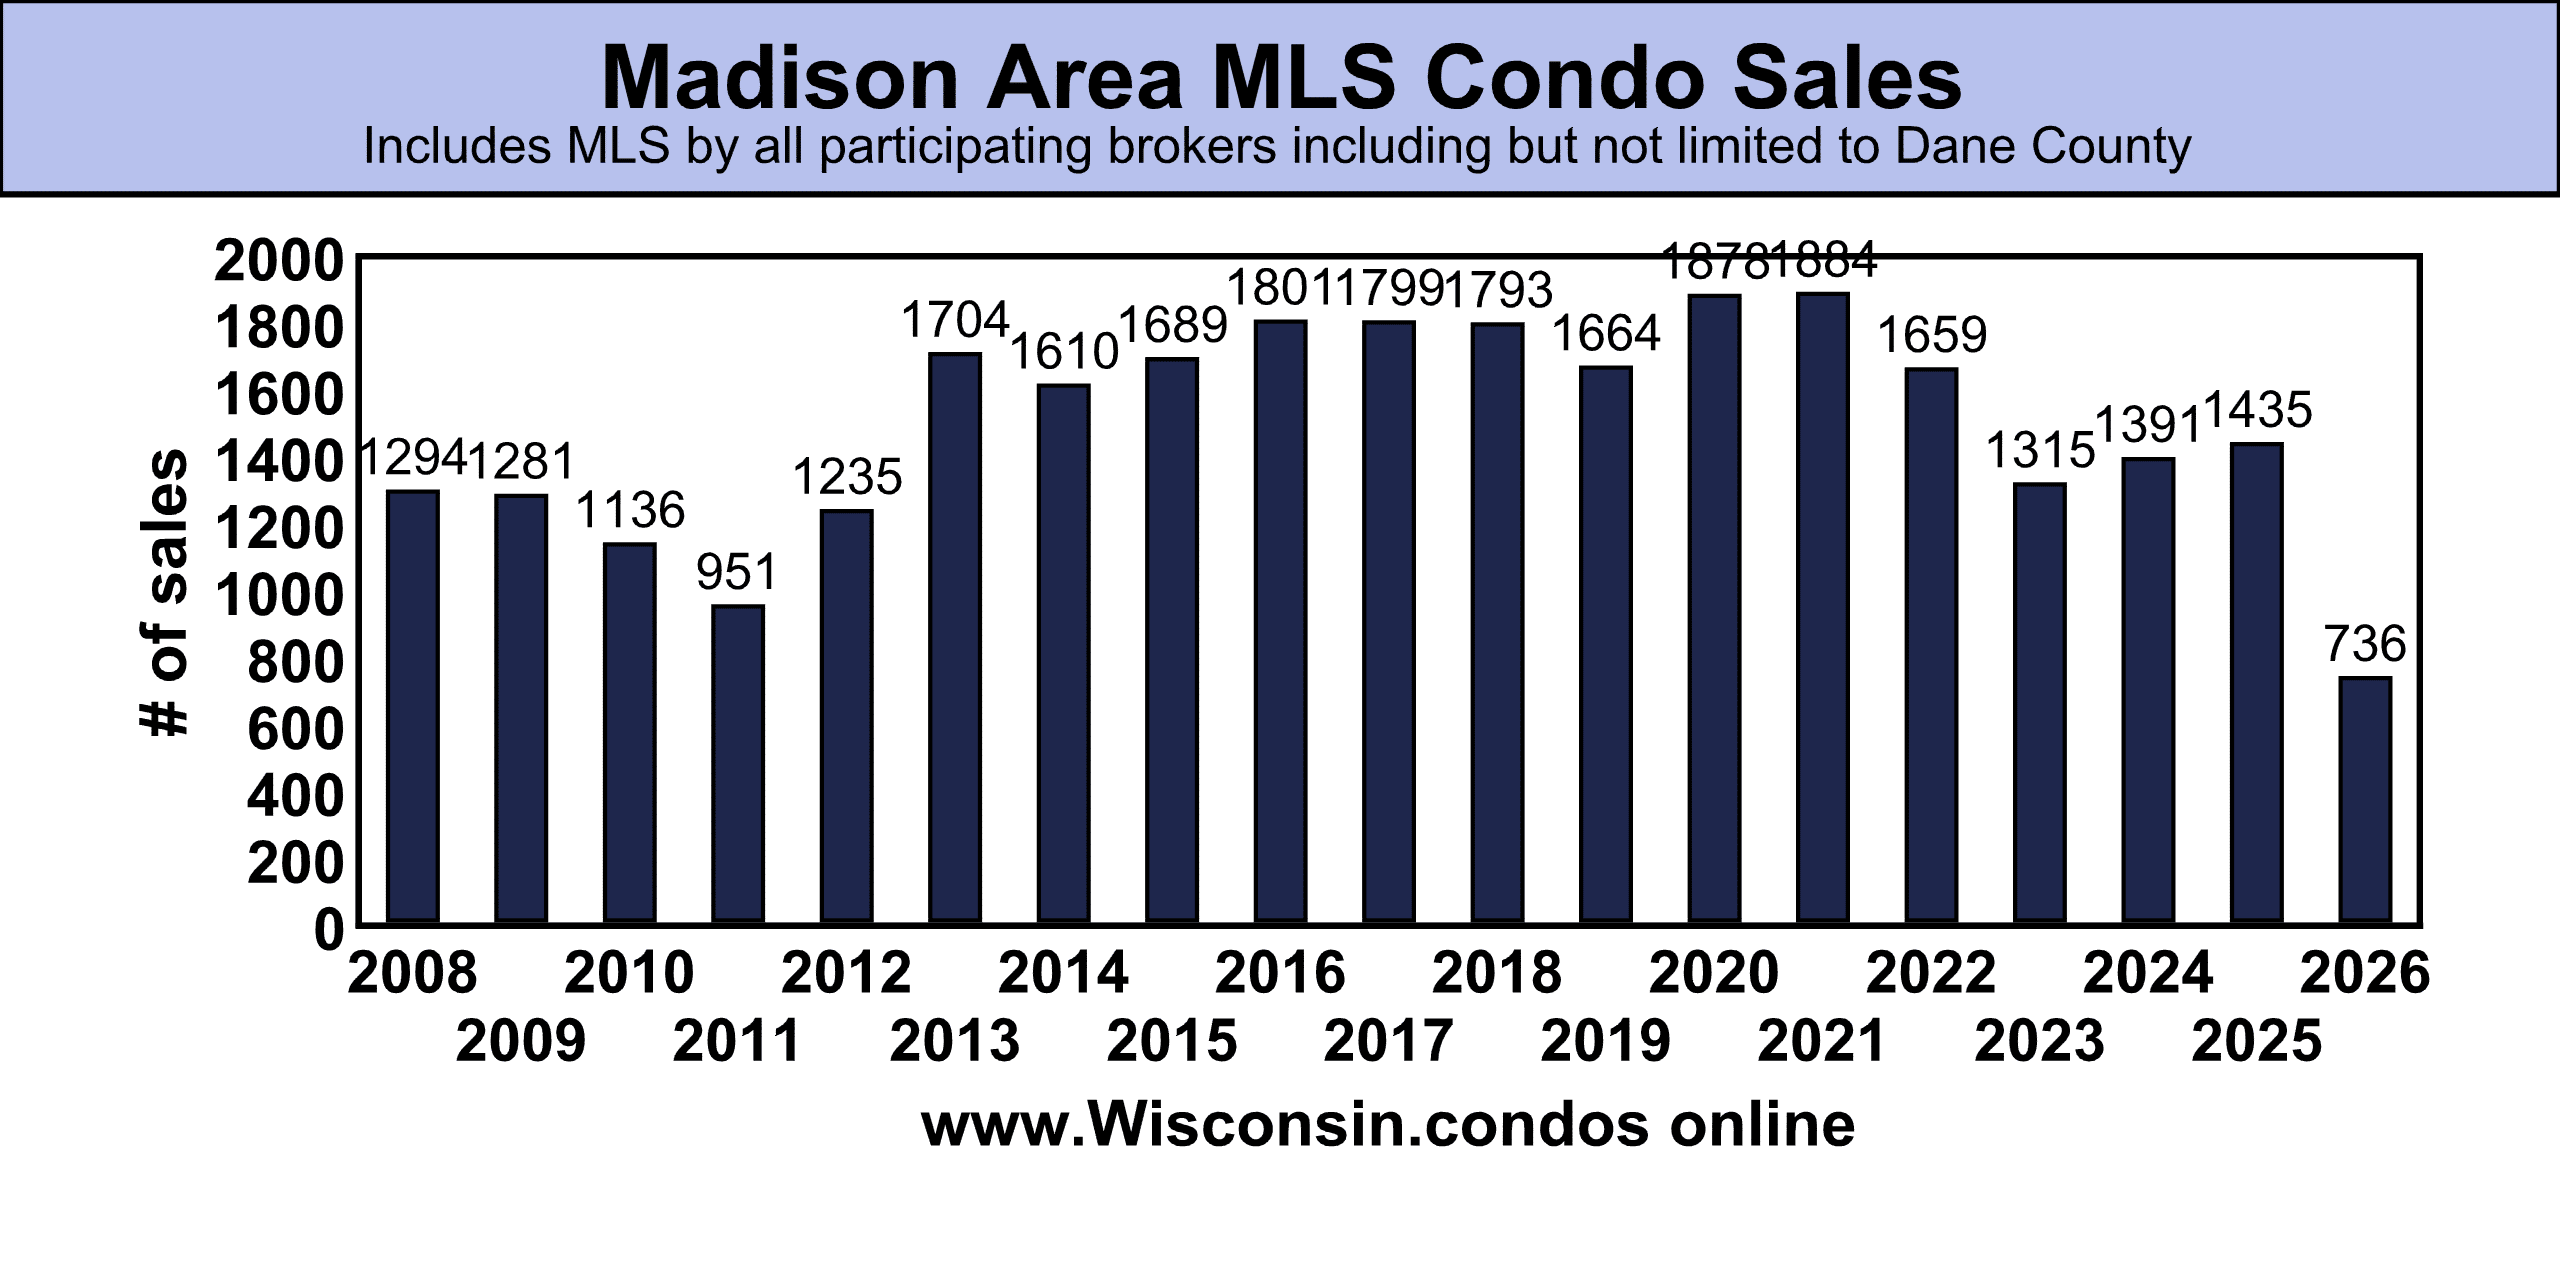
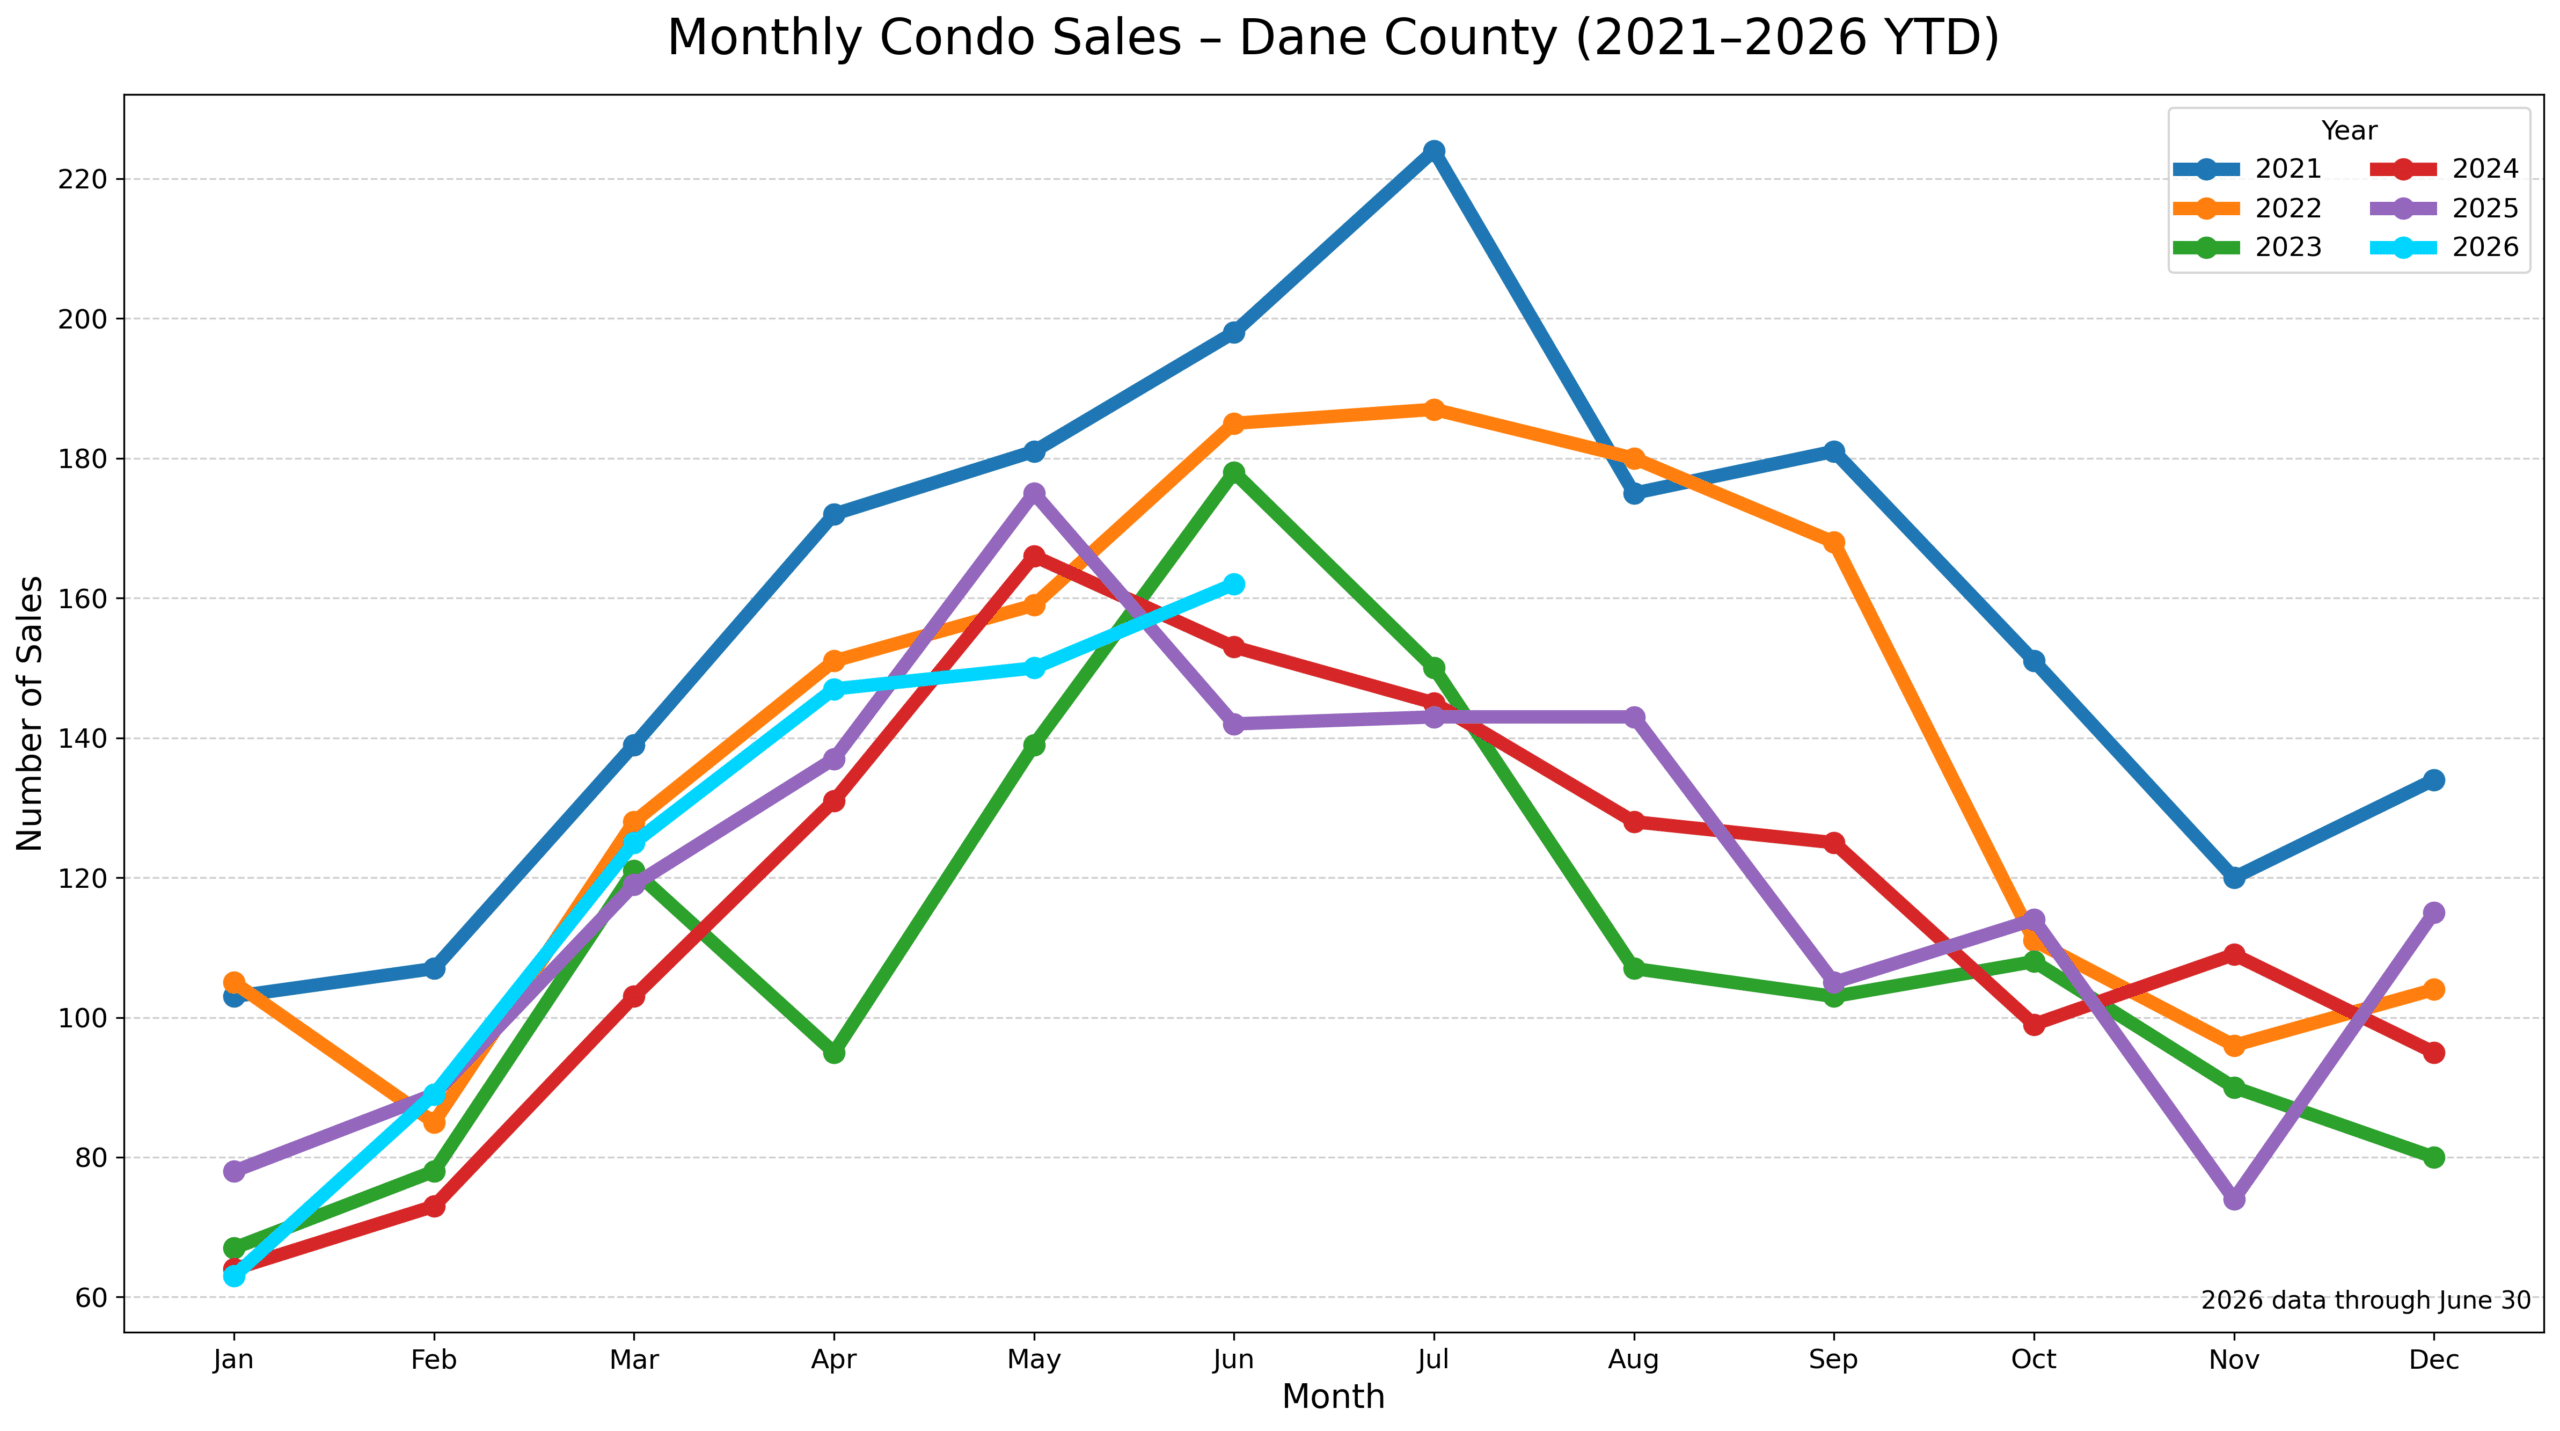
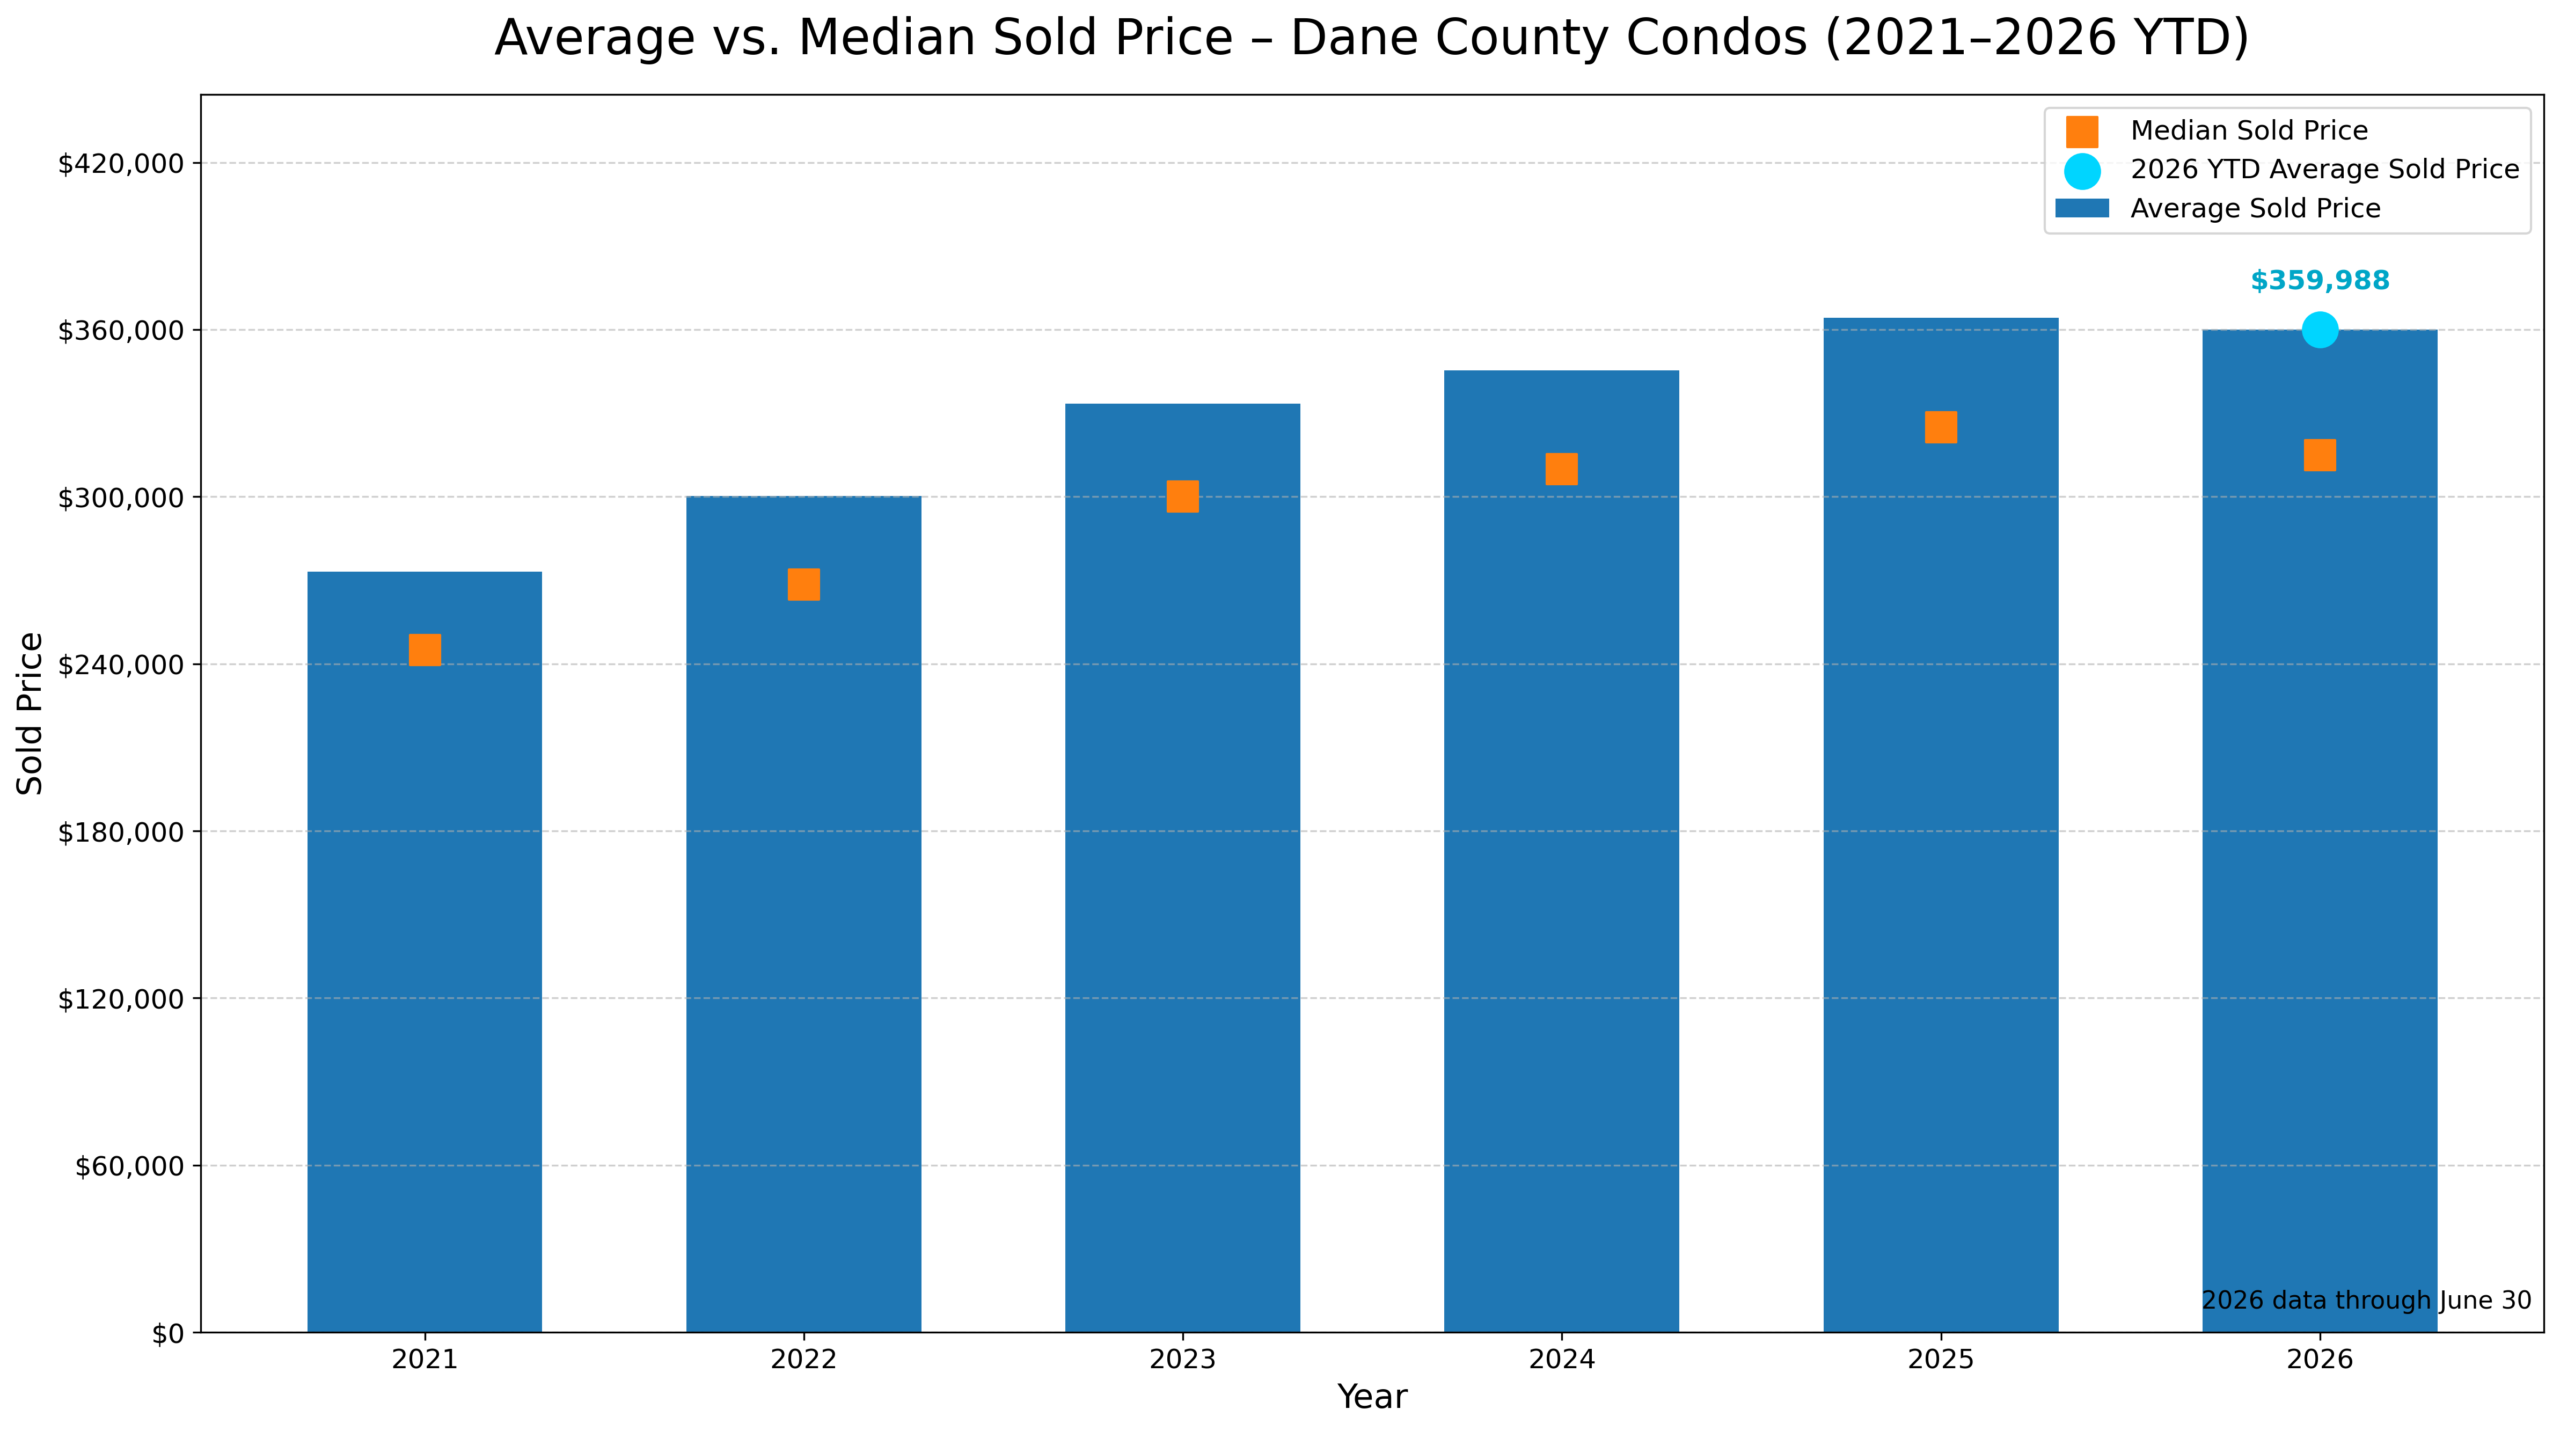
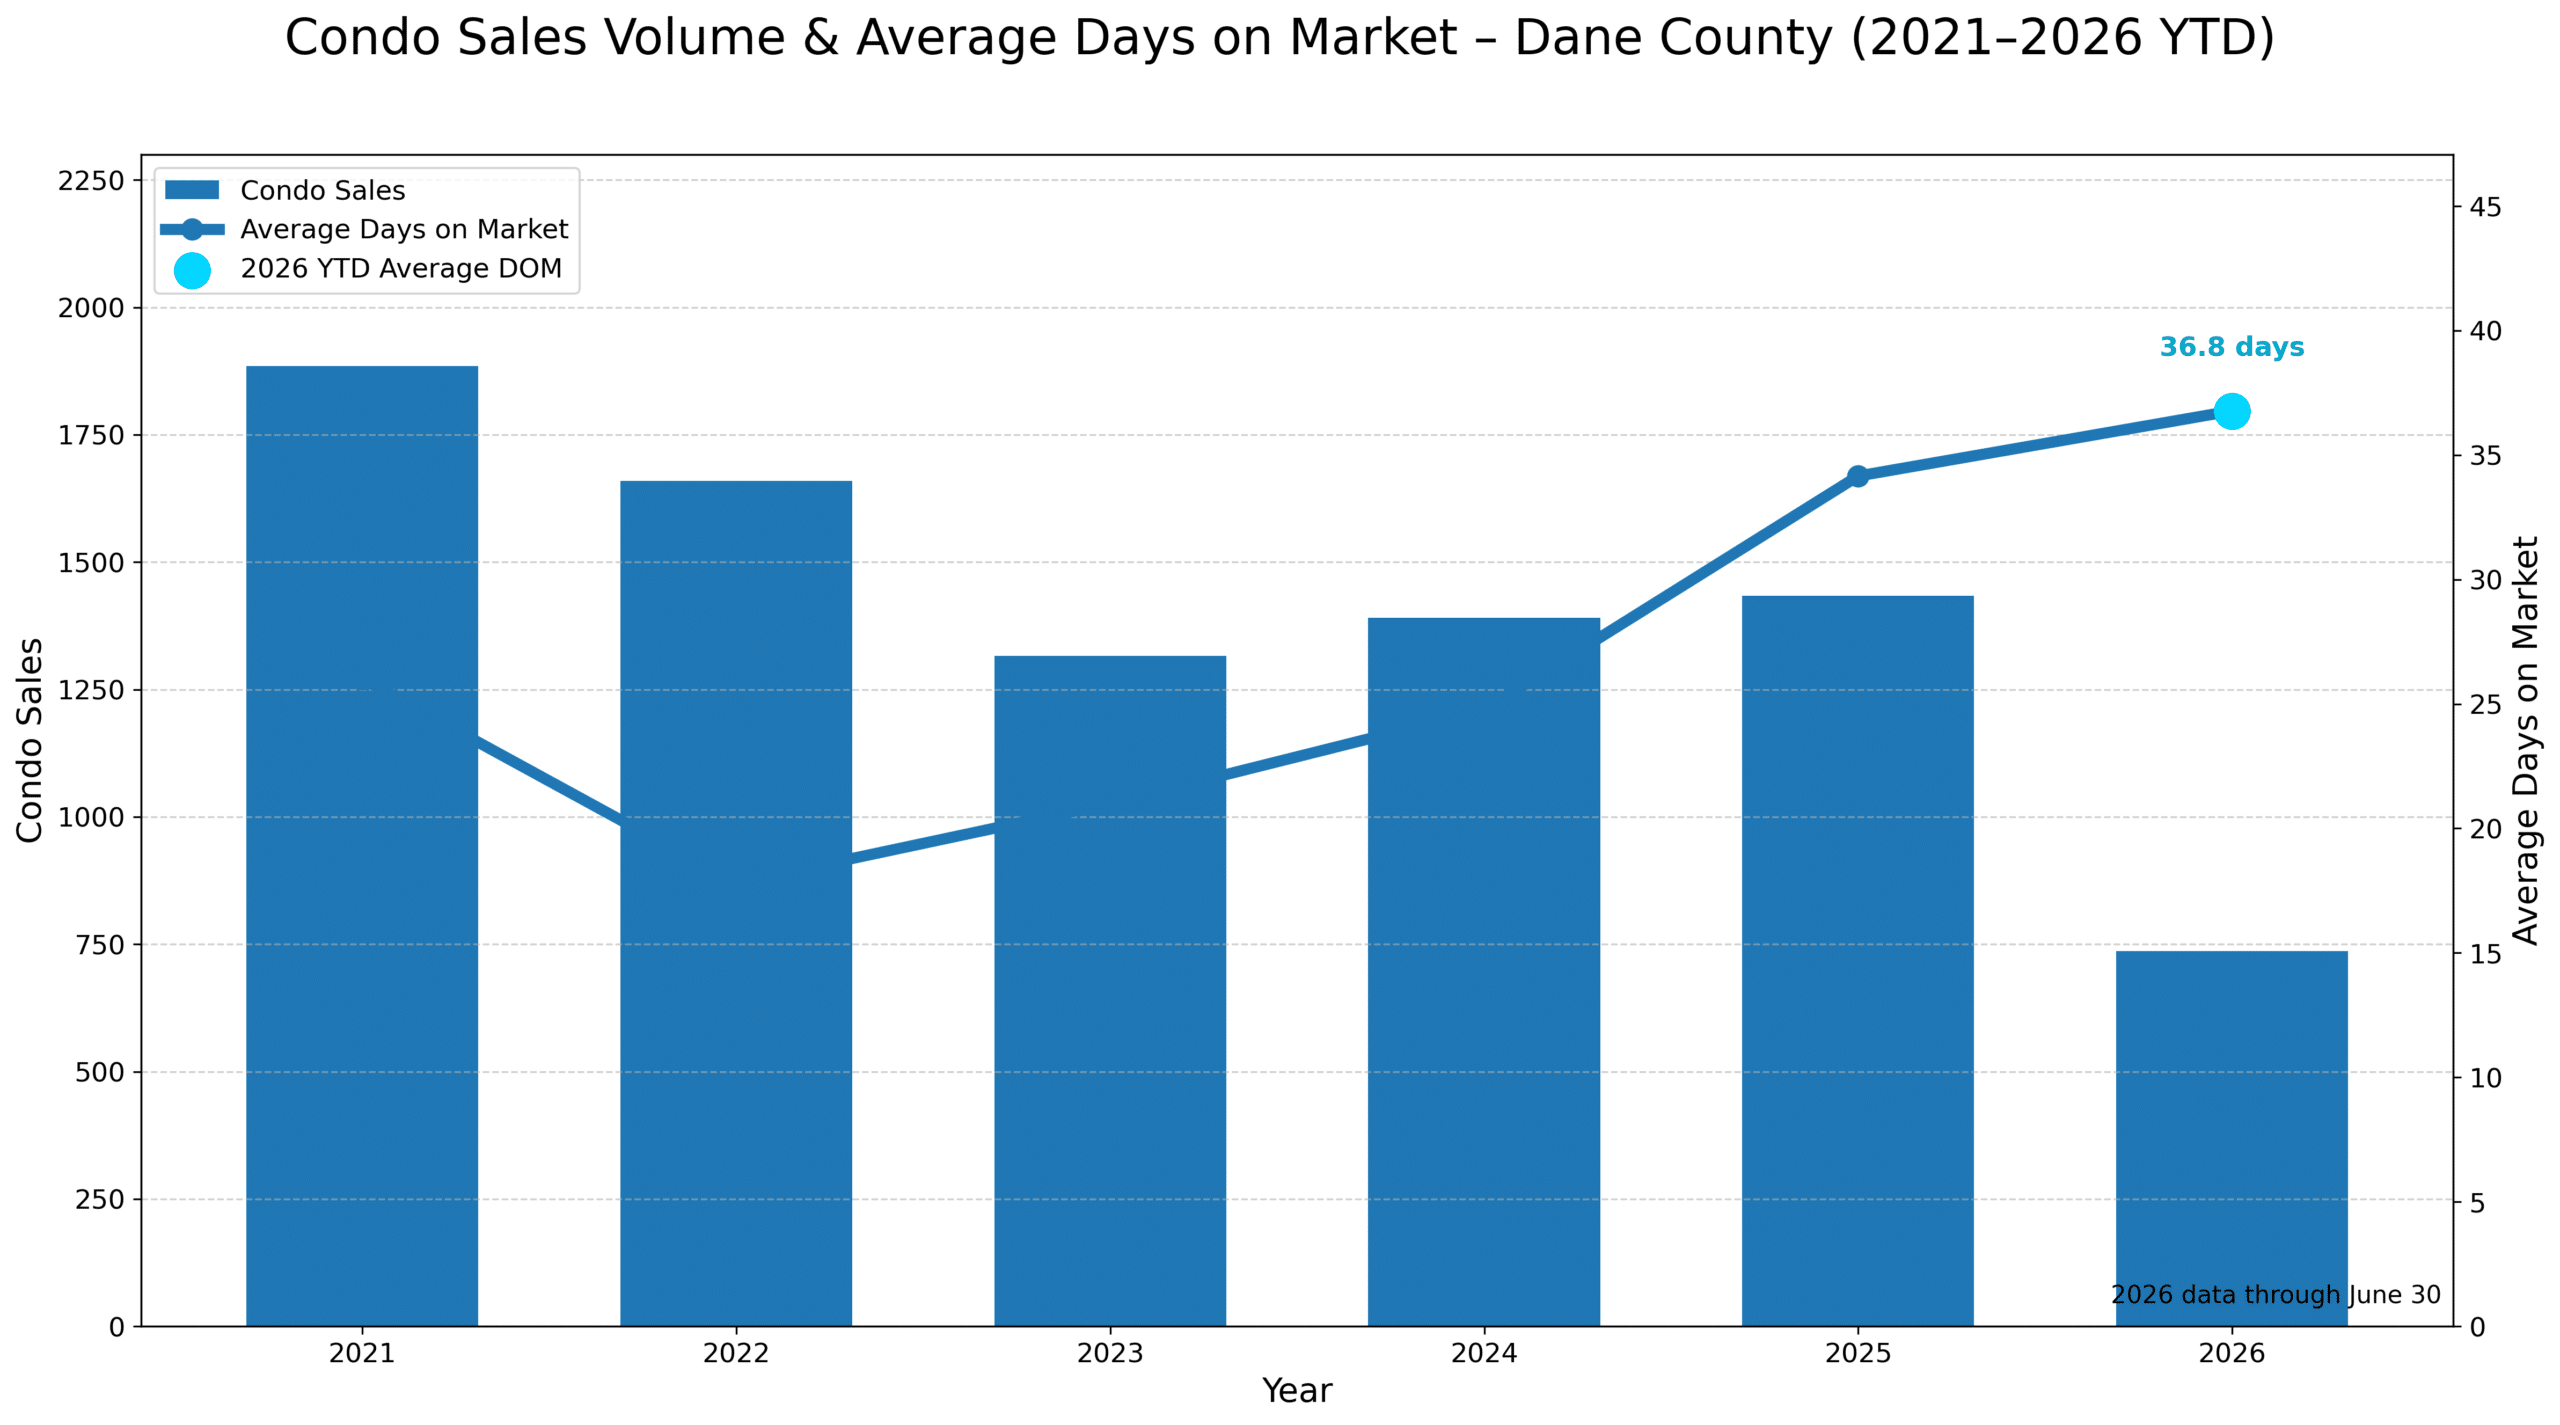
Explore current condo sales trends using verified MLS closing data. The charts below compare 2026 year-to-date activity with prior years, including sales volume, sold prices, days on market and other market indicators.
Looking for reliable condo sales data in Dane County?
You’re in the right place. This page features verified, local data for Madison and Sun Prairie condo markets. Whether you’re buying, selling, or simply tracking trends, this information supports better decisions.
Additionally, we organize all data by month and year, making market shifts easy to follow. Because accuracy matters, only actual MLS closings are included—no estimates or outdated figures.
Moreover, if you’re exploring past performance, you’ll find clear Madison condo sale information with helpful visual breakdowns. Likewise, we provide timely Sun Prairie condo sold data that highlights pricing, volume, and seasonal changes.
As market conditions shift, understanding current Dane County condo sales history helps you prepare for what’s next. Therefore, we update this page frequently to reflect new closings and trends. Plus, comparisons across years give you context for today’s numbers.
So, whether you’re reviewing condo sold info in Madison or planning a move in Sun Prairie, this page offers valuable local insight. And finally, when you’re ready, a trusted Dane County Realtor can help you navigate your next steps with confidence.
📣 DANE COUNTY QUICK HITS OF DATA
📊 Mid-Year 2026 Market Snapshot
⚖️ Prices eased from last year’s highs — but condo sales remained active.
🏷️ Median Sold Price: $315,000
🔻 Down $12,450, or 3.8%, from mid-year 2025
🔺 Still $68,000 higher than mid-year 2021
📈 Average Sold Price: $359,988
🔻 Down $9,815, or 2.7%, from mid-year 2025
🔺 Up more than $86,000 since mid-year 2021
📊 Closings: 736
📍 Just 4 fewer than mid-year 2025
🔺 Higher than the first-half totals recorded in 2023 and 2024
💸 Median List Price: $315,000
📍 Exactly matched the median sold price
➡️ Overall pricing remained closely aligned
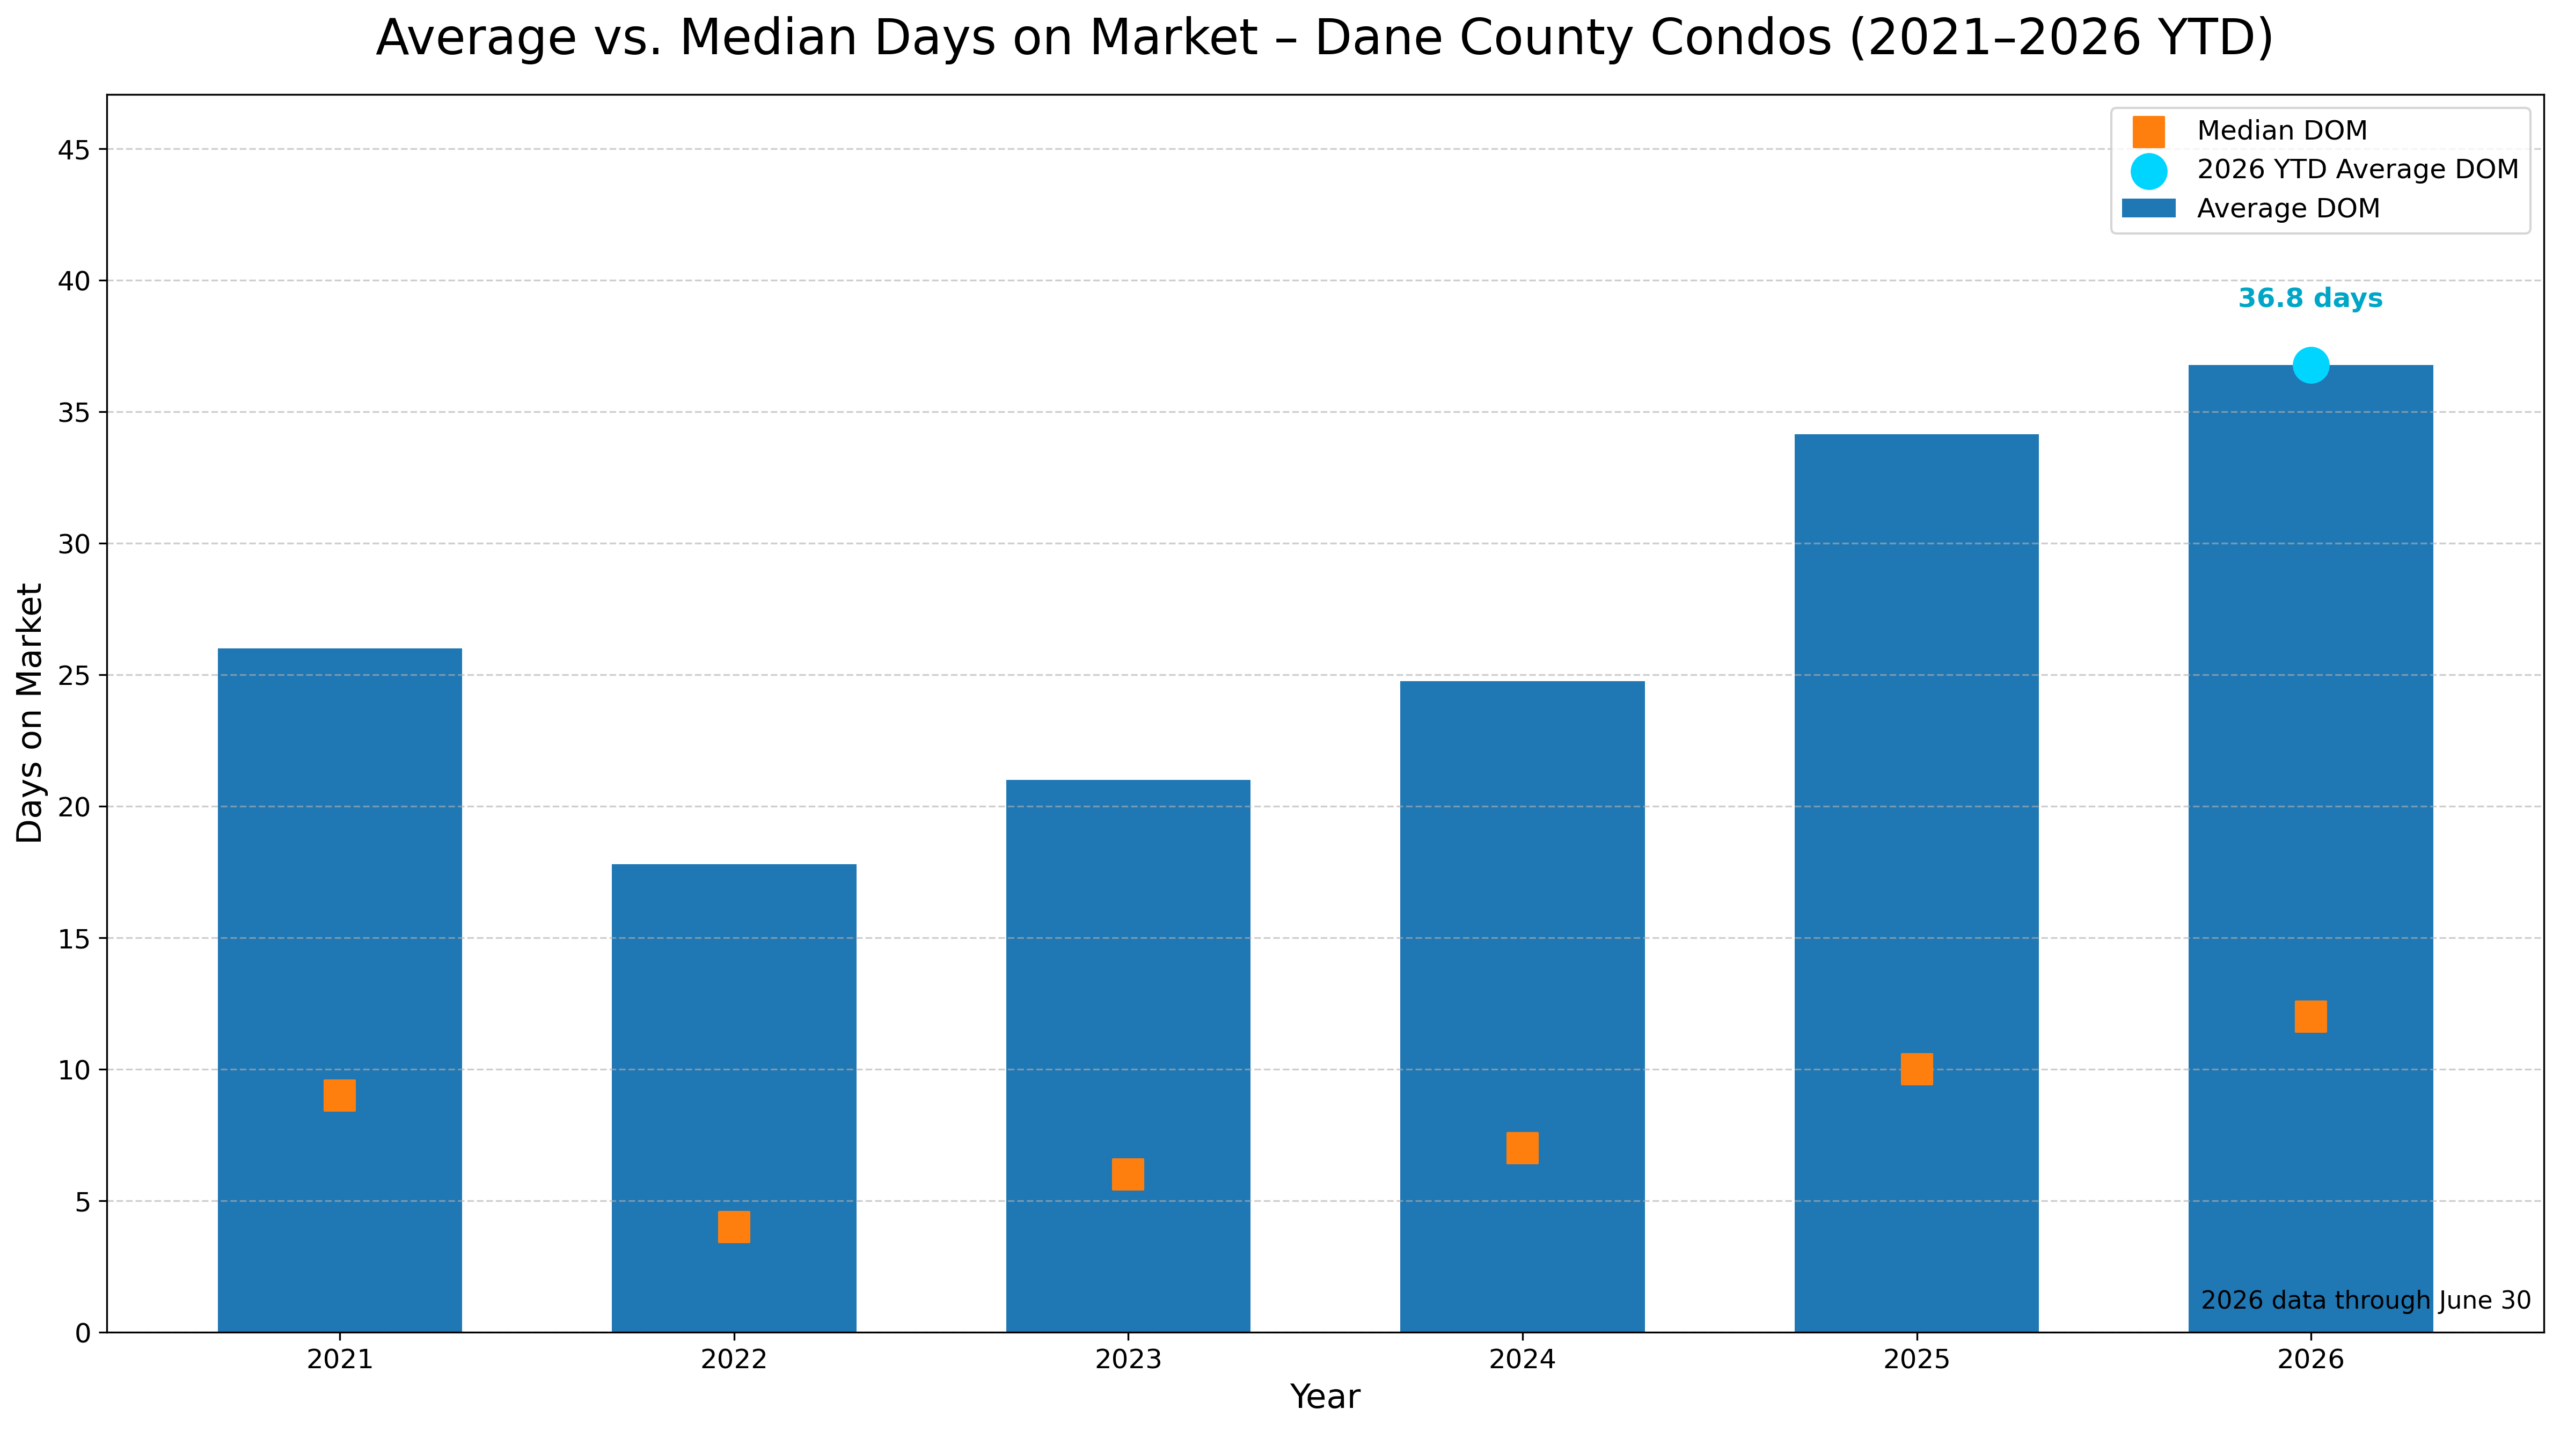
⏳ Median Days on Market: 12 days
⬆️ Up from 8.5 days at mid-year 2025
📍 Still a relatively fast market compared with most Wisconsin counties
📉 Average Days on Market: 36.8 days
➡️ Nearly unchanged from last year’s 36.4-day average
📍 The bigger picture:
Dane County condo prices pulled back modestly from the record levels seen at mid-year 2025, but sales volume barely changed. Of the 736 recorded sales, 322 closed below list price, 202 sold at list price and 212 finished above asking.
Dane County condos cooled slightly in price — without losing much sales momentum.
#DaneCounty #MadisonWI #CondoMarket #MidYearReport #WisconsinCondos #CondoSweetCondo
Cameras During Home Showings: What Wisconsin Buyers and Sellers Should Know
About the Data and Charts
The information shown on this page is based on reported MLS/WIREX sales data. The list price reflects the starting price associated with the property’s most recently reported MLS listing contract. It may not reflect price changes made later under that same listing contract.
Days on market may be calculated differently by each local MLS. Differences in MLS rules, listing histories, relisting practices and data reporting may affect comparisons.
These charts are intended to provide a general overview of market activity and should not be relied upon as a substitute for property-specific research. When a particular sale, price, listing history or market statistic is important to your decision, please ask a licensed real estate agent to verify the underlying MLS information.
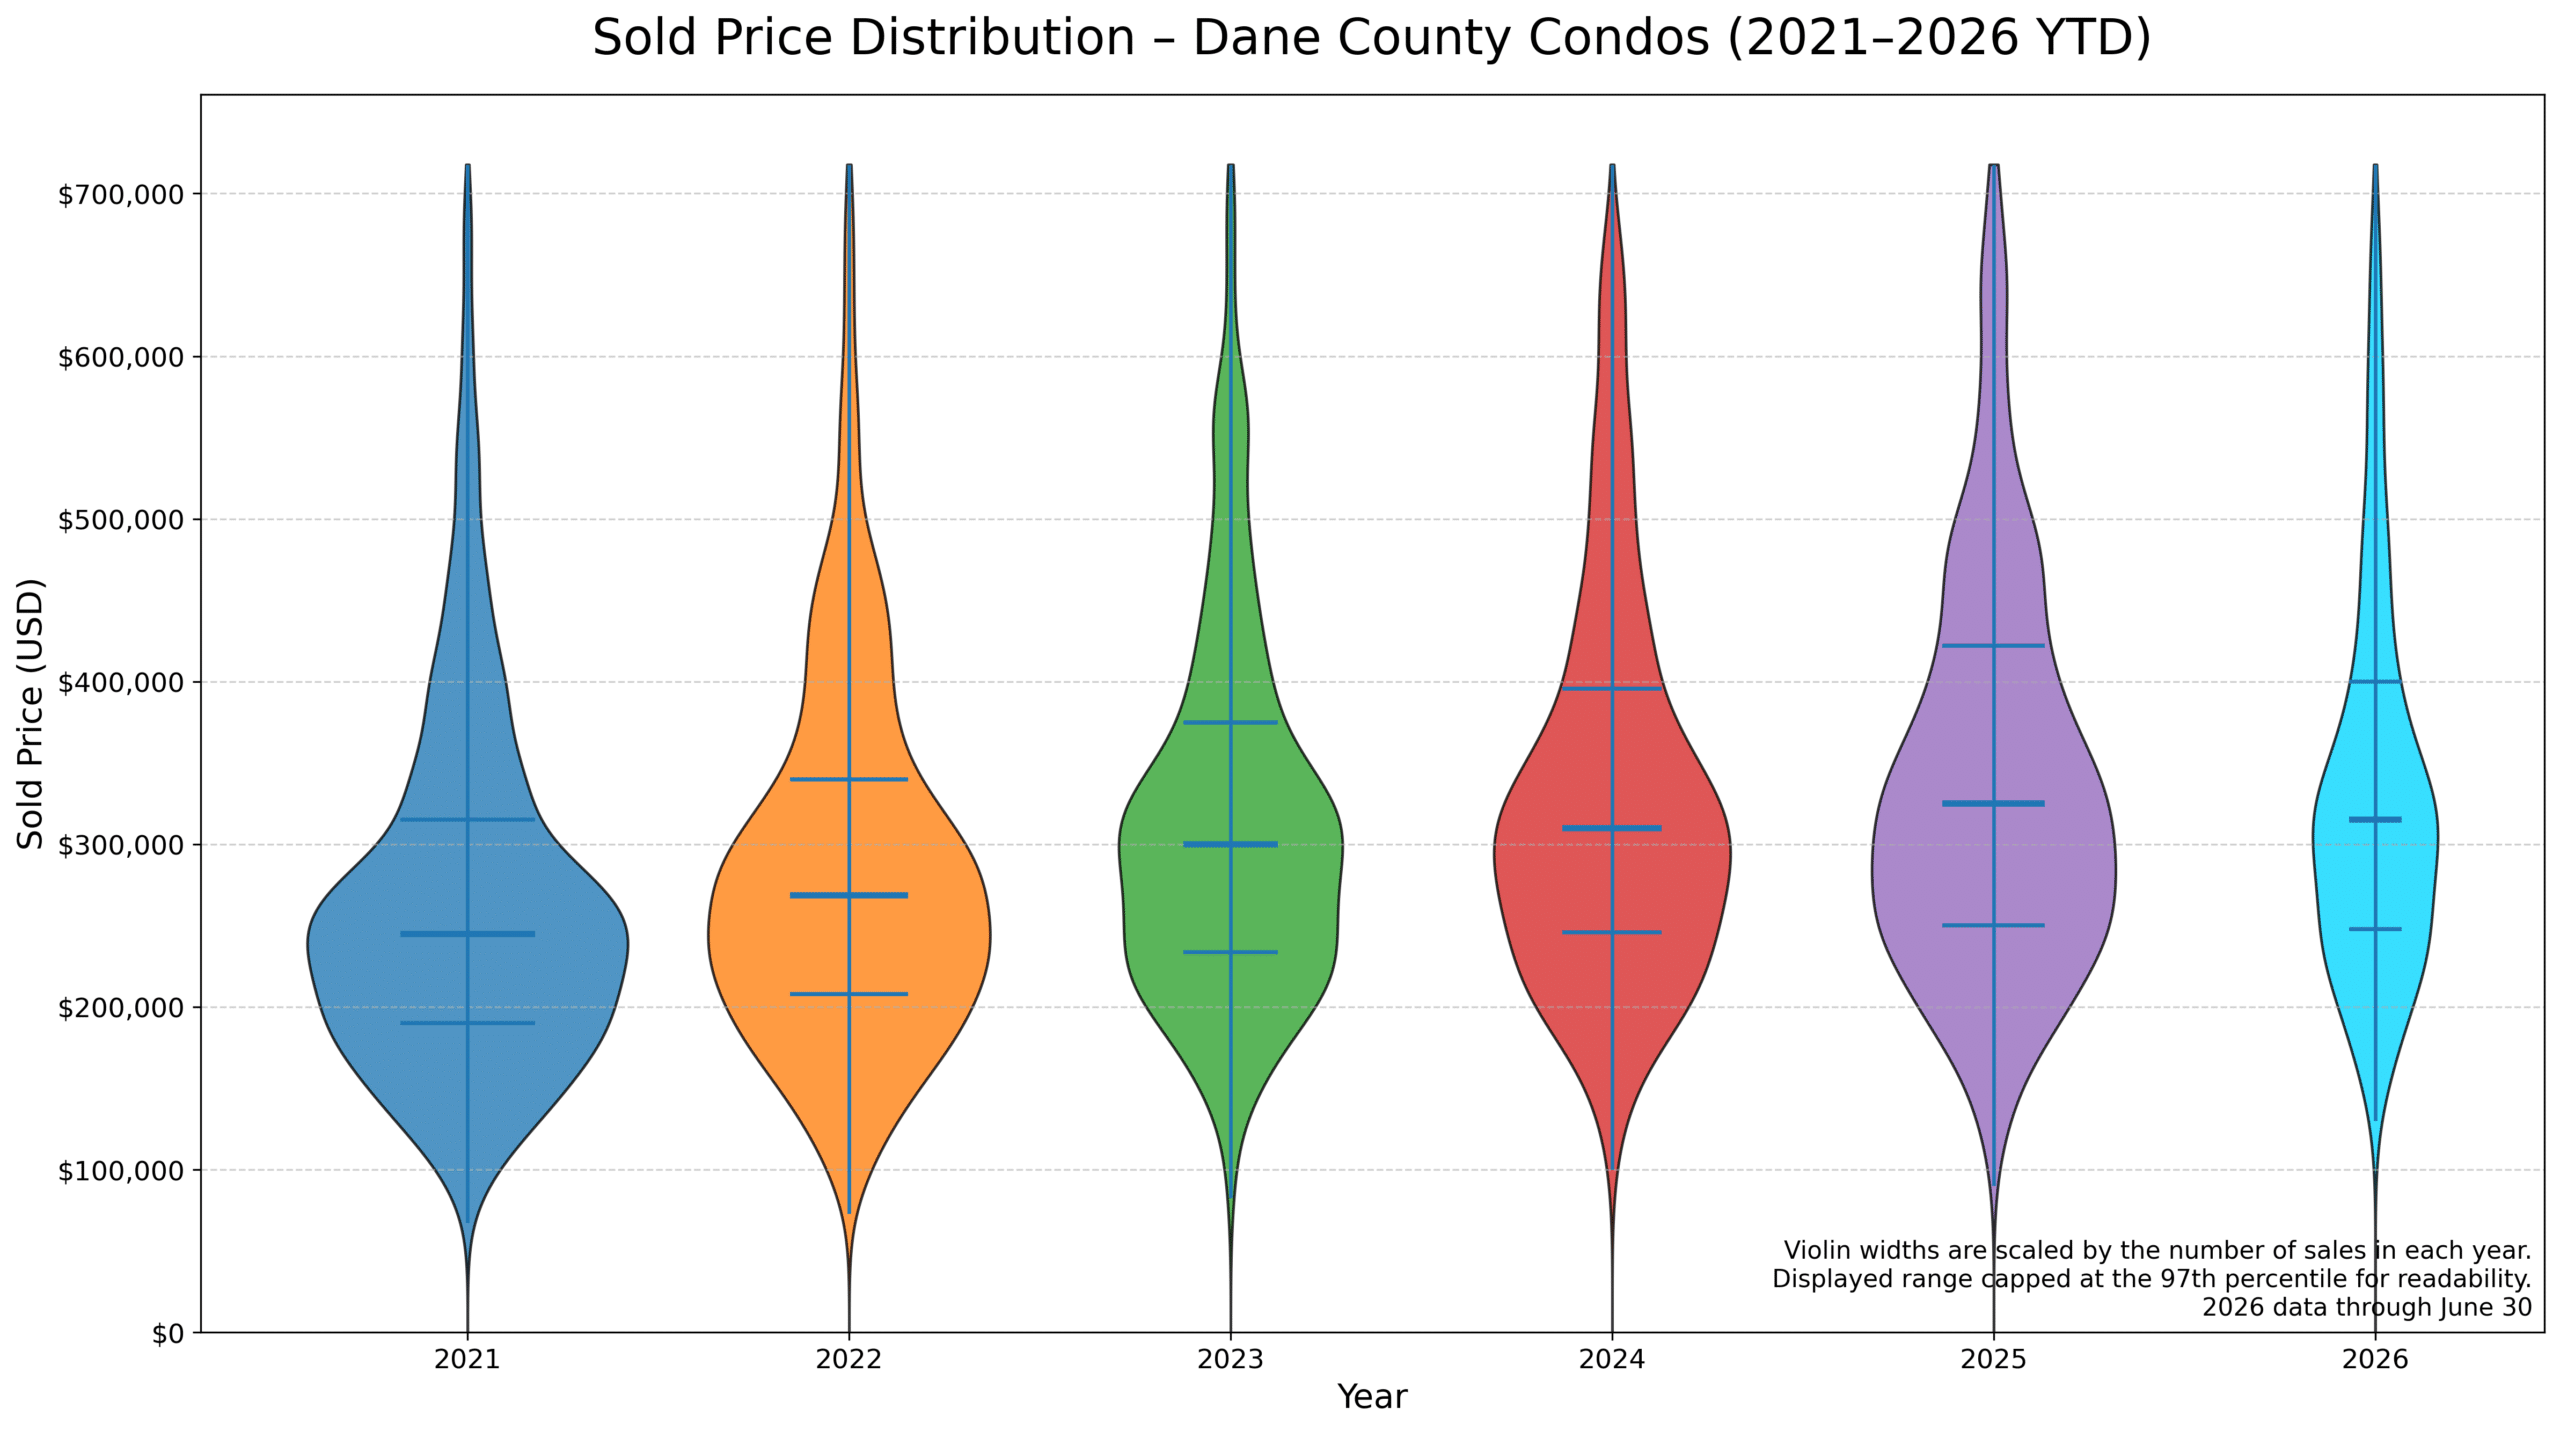
Sold Price Distribution Chart
The sold-price distribution chart uses violin shapes to show where sale prices were most concentrated during each year.
- Wider sections indicate a greater concentration of sales within that price range.
- Each violin’s overall width is scaled according to the number of sales reported for that year.
- The visible price range is capped at the 97th percentile so a small number of unusually high sales do not compress the main portion of the chart.
- The internal lines identify the lower quartile, median and upper quartile.
- Bright cyan identifies 2026 year-to-date data through June 30.
Rotate Tablet or Phone for Graph Below Showing Priced Reduced Count for Homes in Dane County
Share this information with friends? or bookmark it for yourself.
Buying or Selling? Contact us at 608-247-5528 for a free, no-commitment, consultation.
Because, “www.Wisconsin.condos. Targeted focus. Better Results.” Ask us how.
Follow our Dane County Facebook Page
Apparently, 22–0 wasn’t enough.
The Brewers just won 20–0—becoming the first team in MLB history with two 20-run shutouts in one season.
Wilbur may need to head back to the batting cage. ⚾️😂
#MilwaukeeBrewers #BrewersBaseball #Wisconsin #WisconsinCondos

… See MoreSee Less
- likes 0
- Shares: 0
- Comments: 0
0 CommentsComment on Facebook
🏡 Sales slowed—but prices didn’t.
Existing-home sales across the country declined during August. However, the median sales price still increased, and the number of available homes continued to grow.
That combination may provide qualified buyers with more time to compare properties and potentially negotiate terms. For sellers, proper pricing and presentation remain especially important.
Closer to Wisconsin, Midwest sales were down 2.1% from last year, while the median price increased 3.3% to $340,400.
National statistics provide useful context, but every Wisconsin community—and every condominium association—can behave differently.
Source: National Association of REALTORS®
August 2026 Existing-Home Sales Report
#WisconsinRealEstate #WisconsinHomes #WisconsinCondos
… See MoreSee Less
0 CommentsComment on Facebook

