

📊 Mid-Year 2026 Condo Market Update

MLS sales data through June 30, 2026

Explore current condo sales trends using verified MLS closing data. The charts below compare 2026 year-to-date activity with prior years, including sales volume, sold prices, days on market and other market indicators.


Looking for Condo Sale Data in Racine County?

You’ve found a trusted local resource. This page features current and historical Racine condo sold data you can count on. Whether you’re a buyer, seller, or market watcher, this data provides real insight.

Additionally, we highlight sales activity across the area—including detailed Mount Pleasant condo sales. Because market trends shift over time, this page organizes the data year by year. All stats are pulled from verified MLS closings—no estimates or assumptions.

Moreover, if you’re curious about past pricing, we provide accurate Racine condo sold information in an easy-to-read format. Likewise, you’ll find Mount Pleasant condo sale news presented clearly with graphs and monthly updates.

As condo activity changes, you’ll want reliable condo sold news in Racine to make better decisions. Therefore, this page helps you track trends and identify pricing patterns over time. Plus, we update regularly to keep the information fresh.

So, whether you’re reviewing Condo Sale Data in Racine County to prepare your listing or time your next purchase, this is the place to start. And finally, when you’re ready for guidance, a top local Realtor can help you take action.

📣 QUICK HITS OF RACINE COUNTY DATA

📊 Mid-Year 2026 Market Snapshot

⚖️ Prices pulled back from 2025’s surge — but condos sold faster.

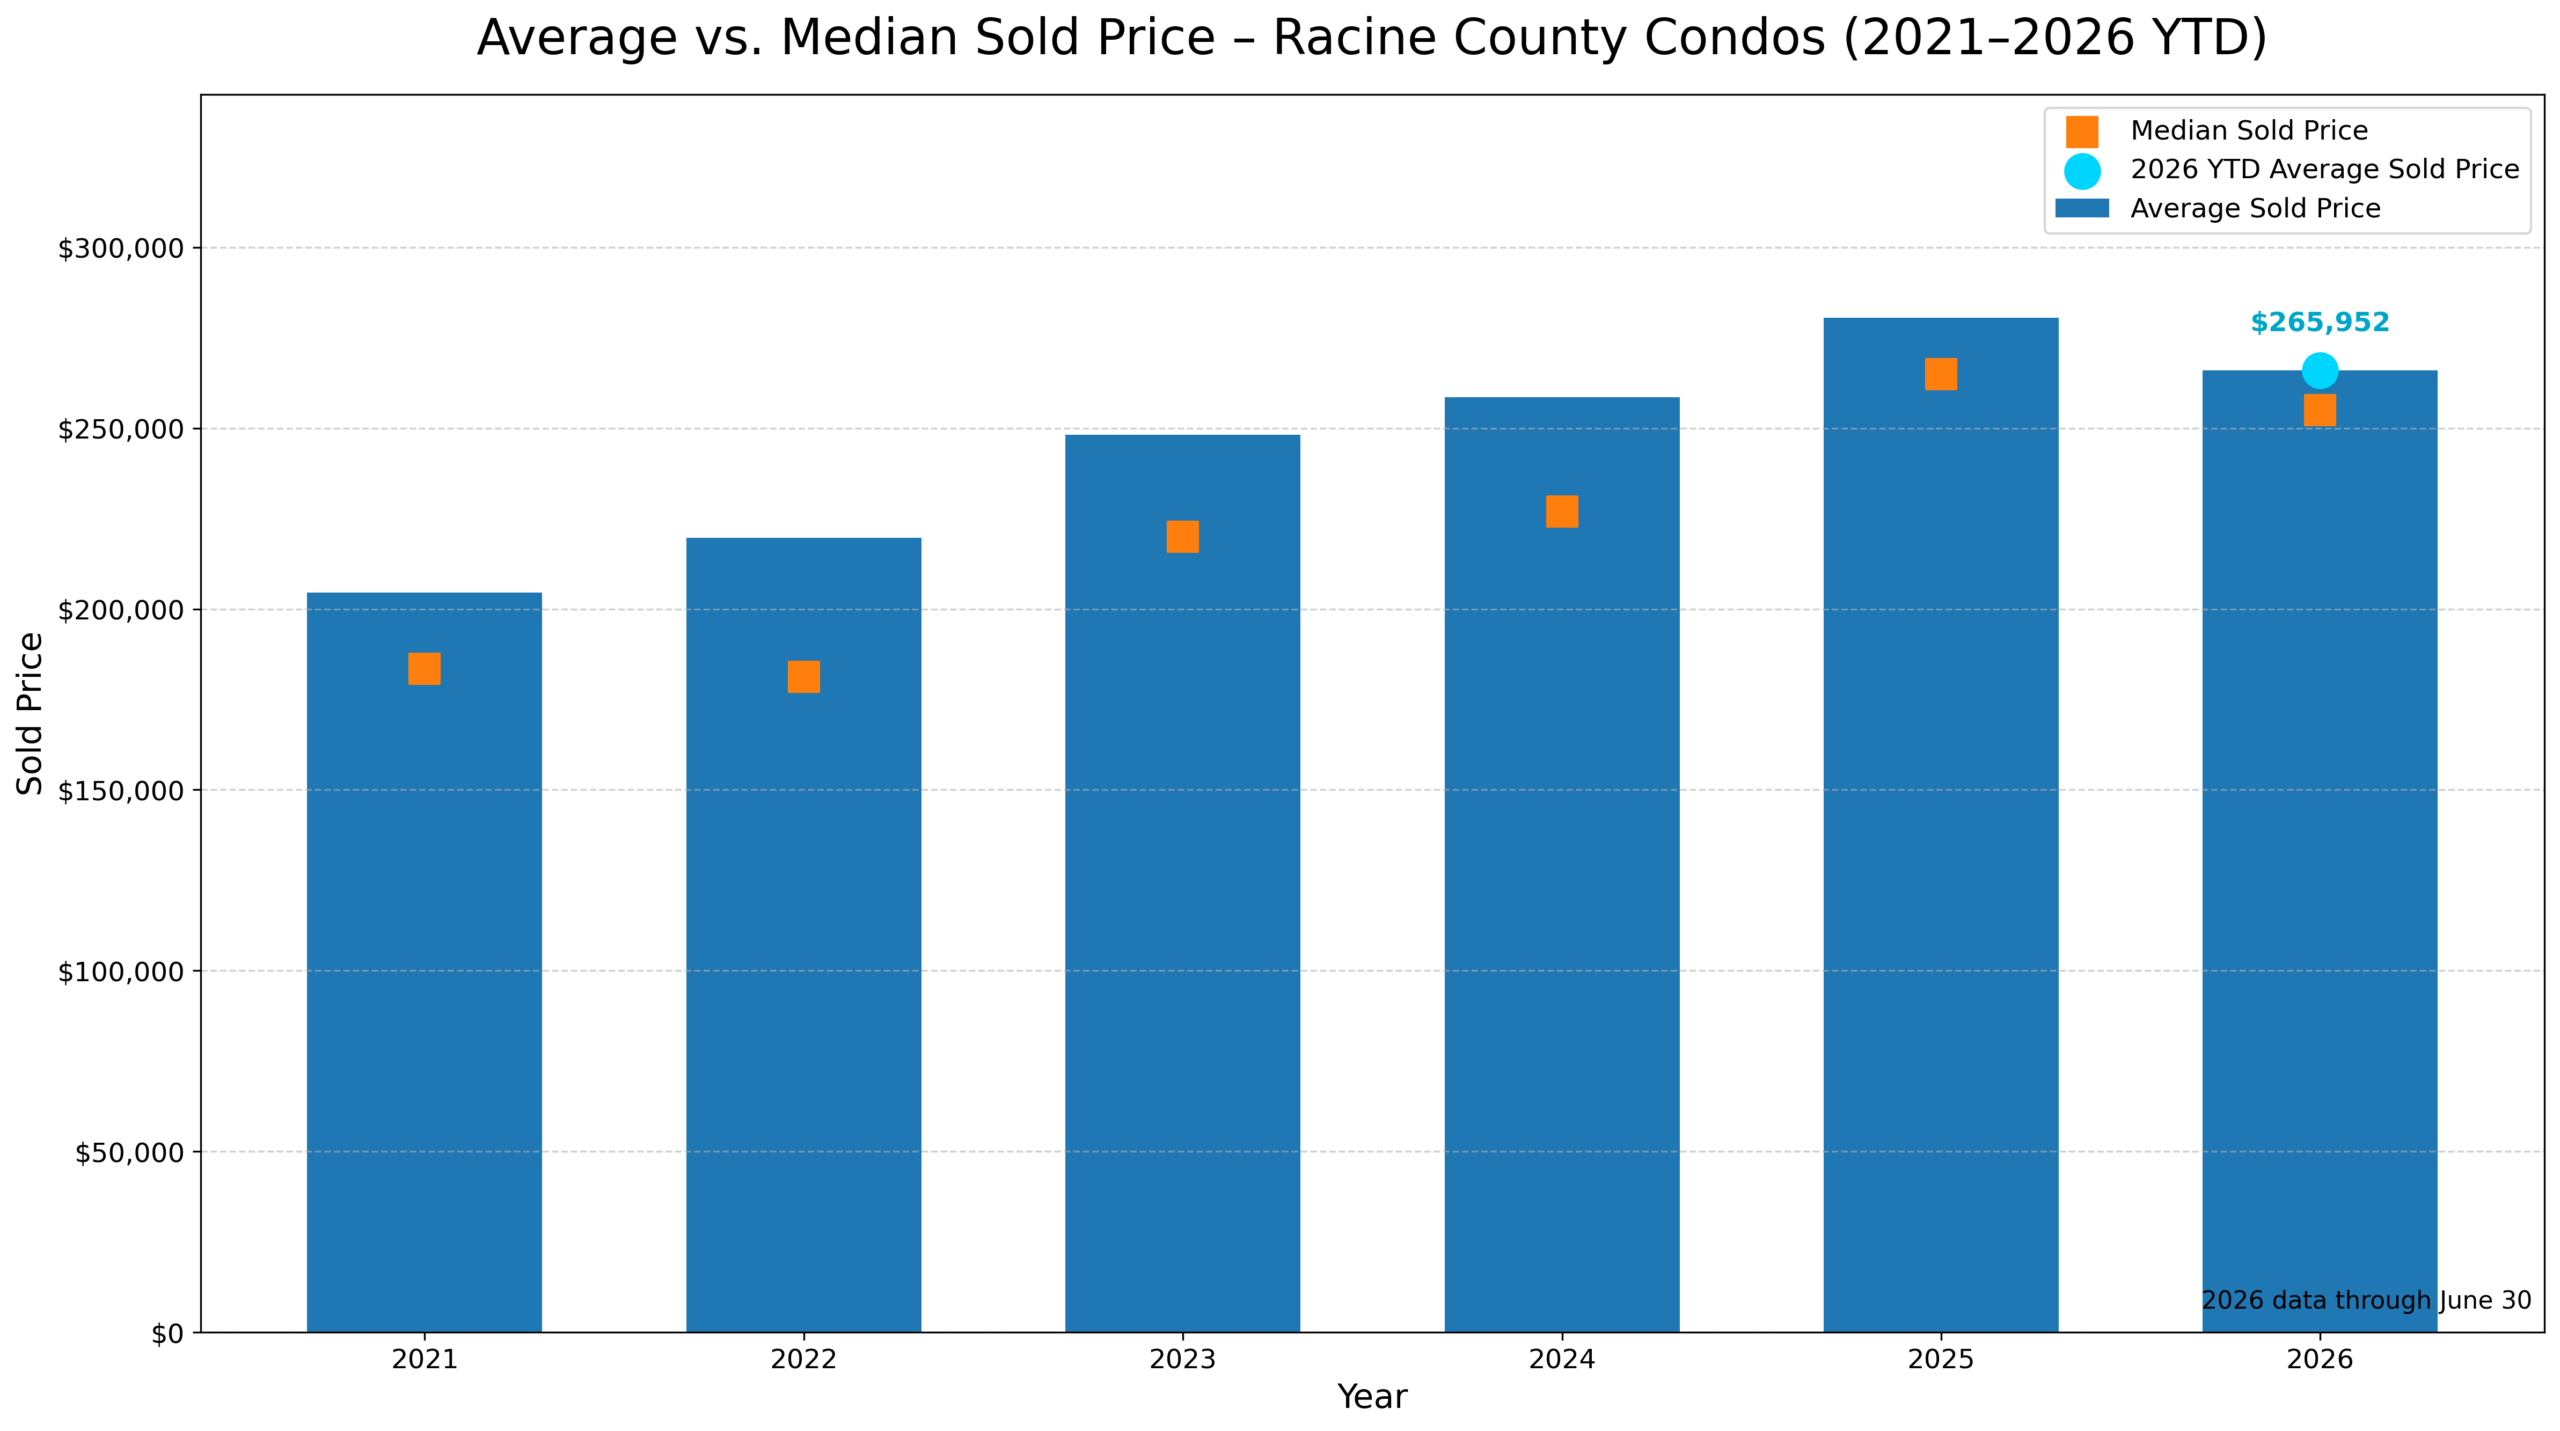
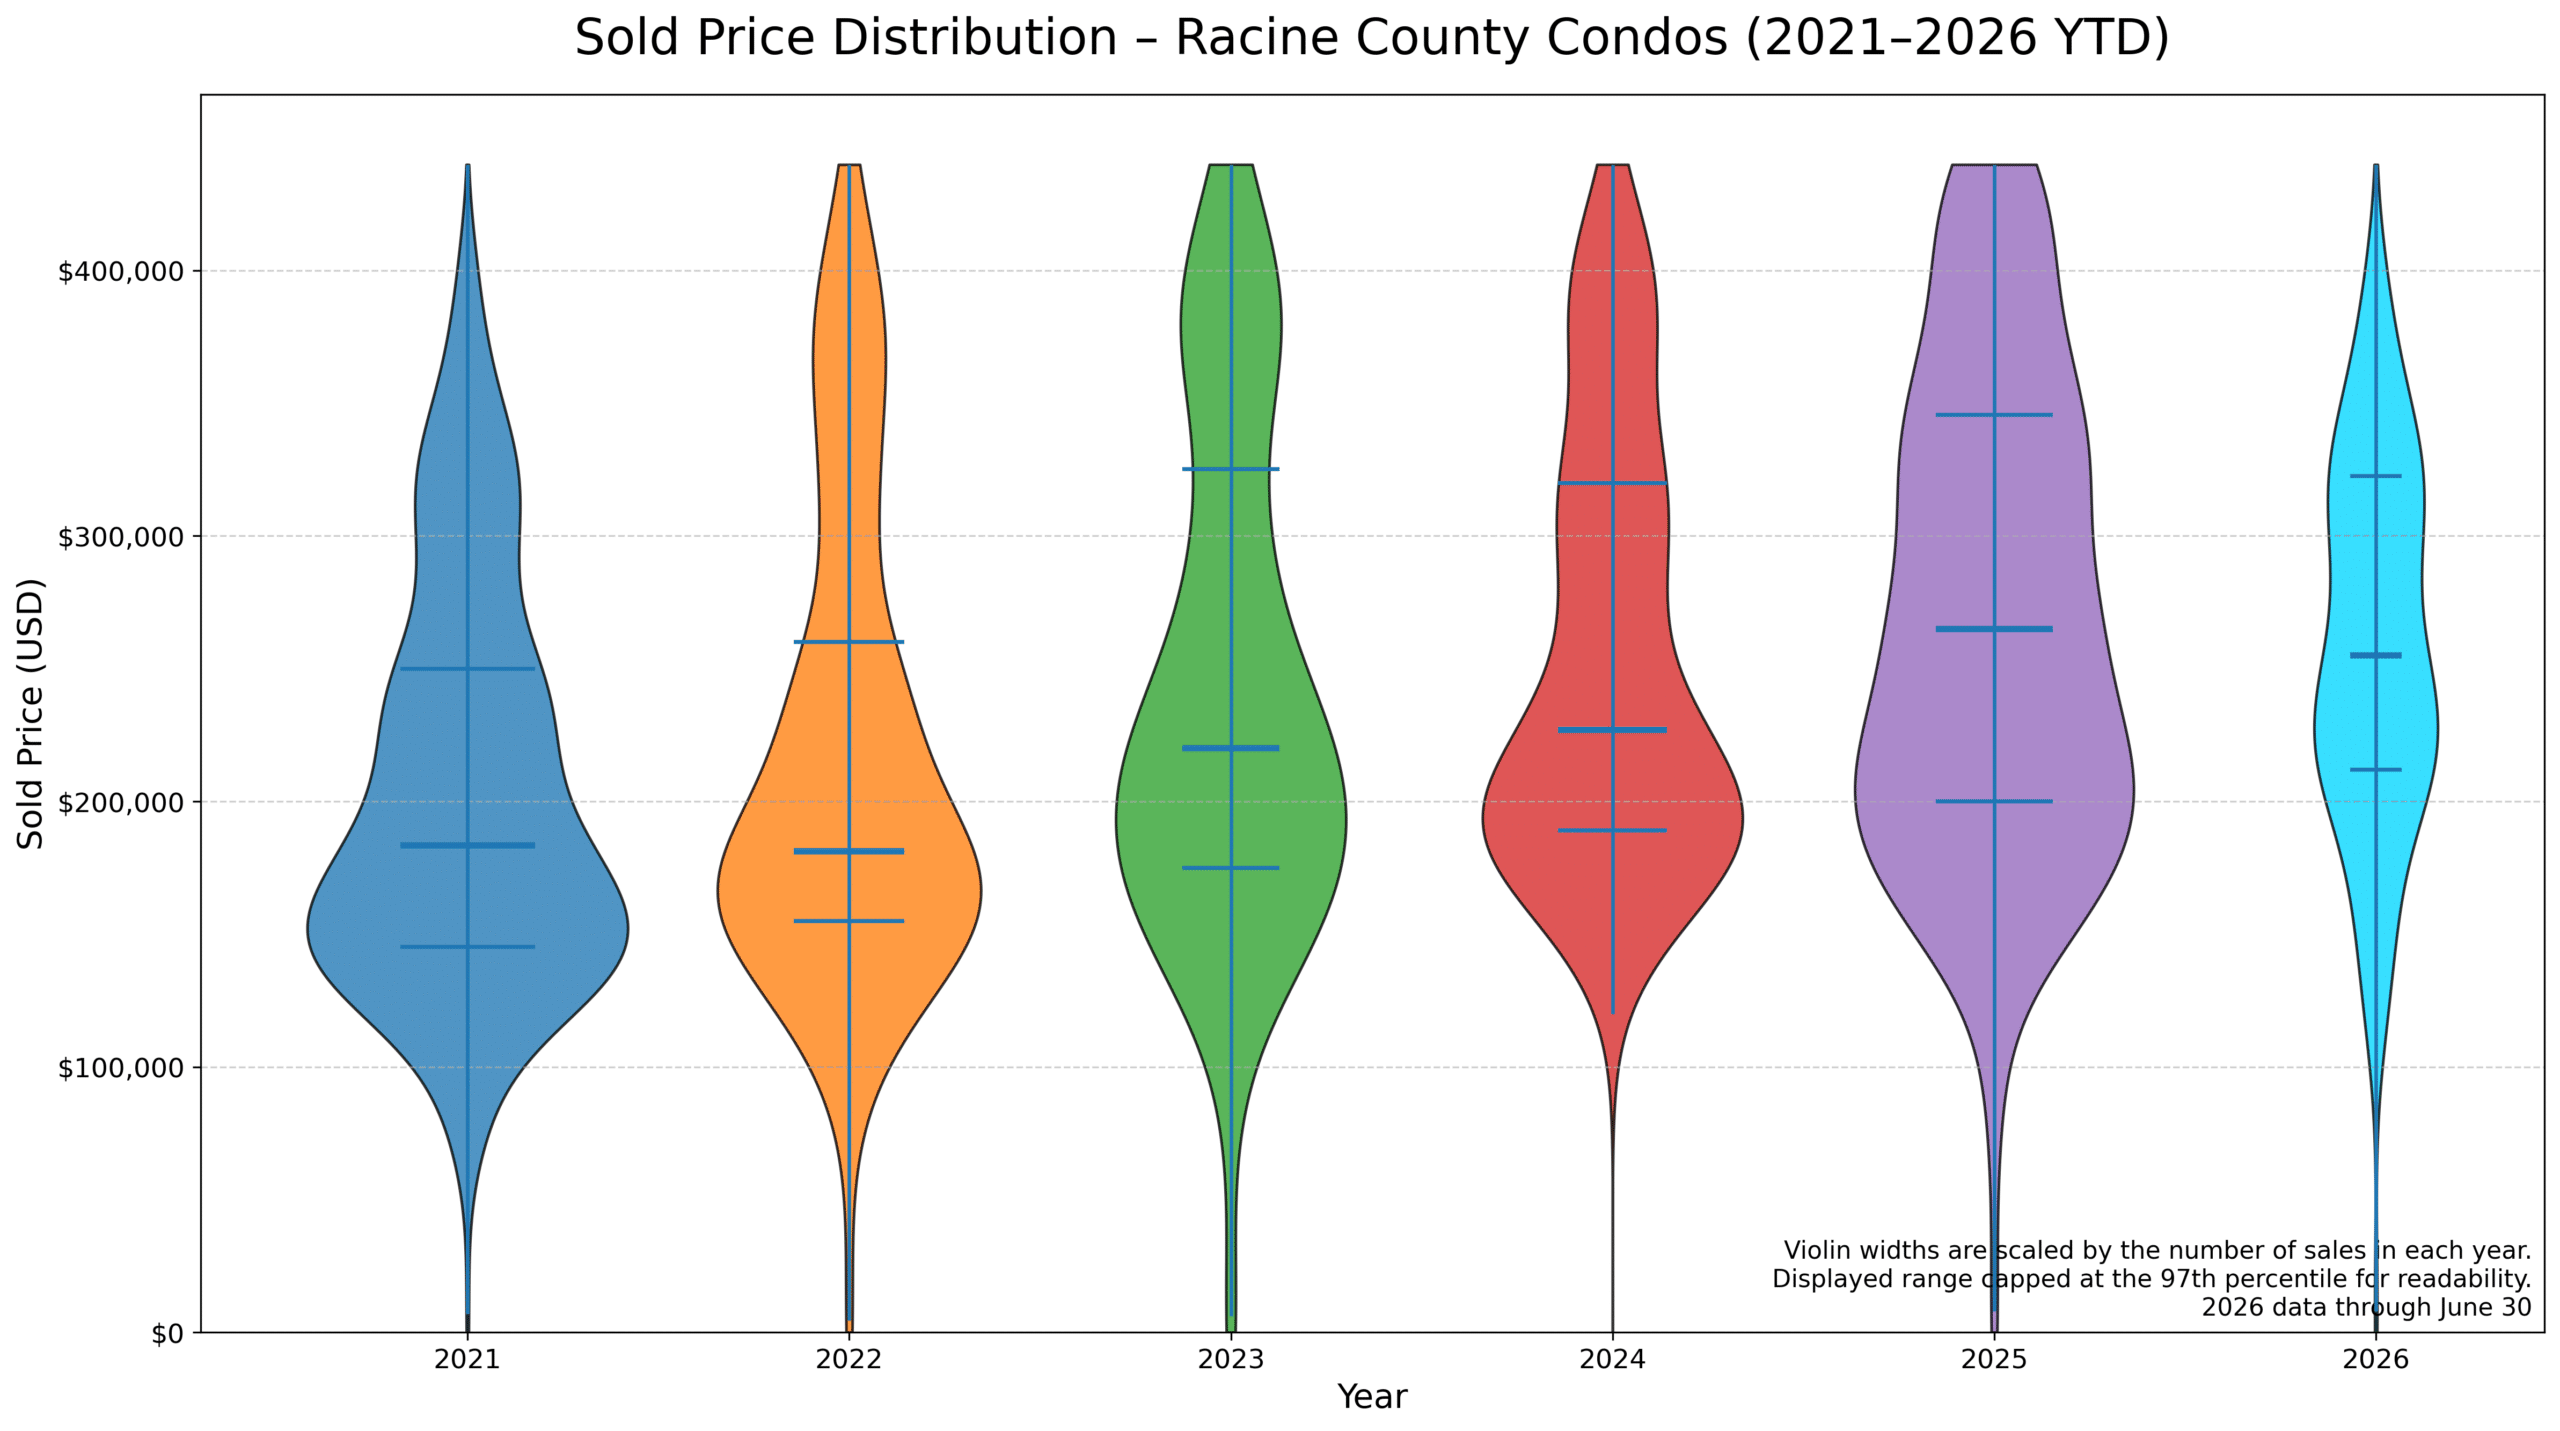
🏷️ Median Sold Price: $255,000
🔻 Down $15,500, or 5.7%, from mid-year 2025
🔺 Still $75,000 higher than mid-year 2021
📍 Second-highest first-half median in the six-year comparison

📈 Average Sold Price: $265,952
🔻 Down $15,352, or 5.5%, from mid-year 2025
📍 Still the second-highest first-half average in the six-year comparison

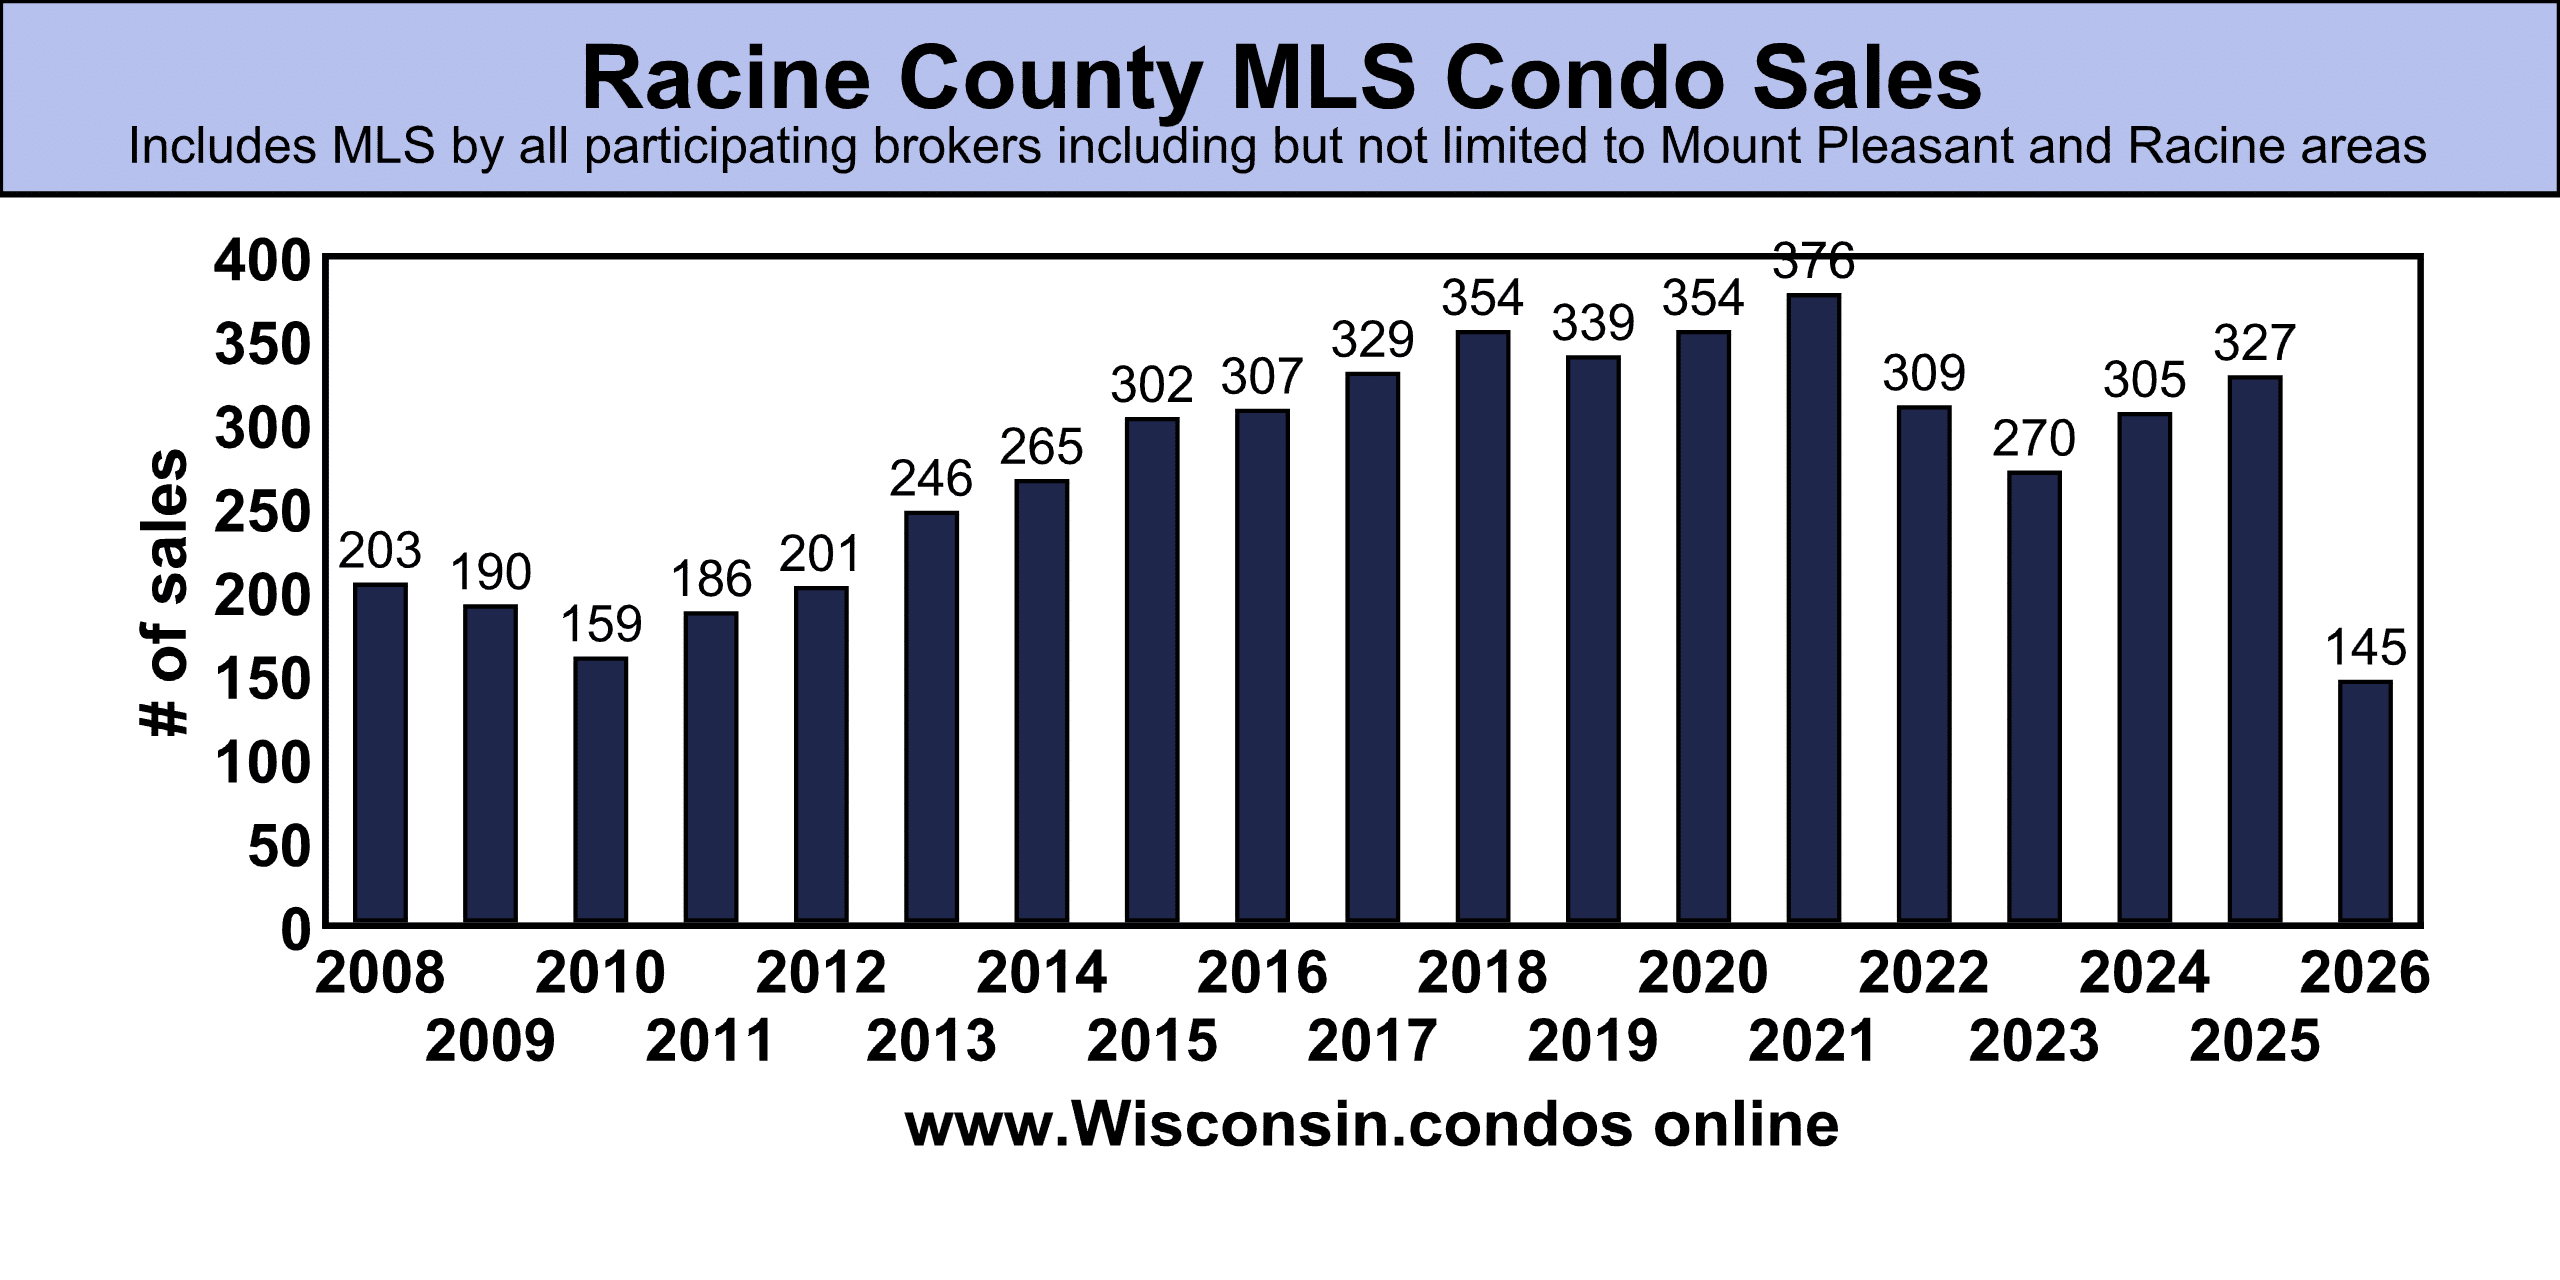
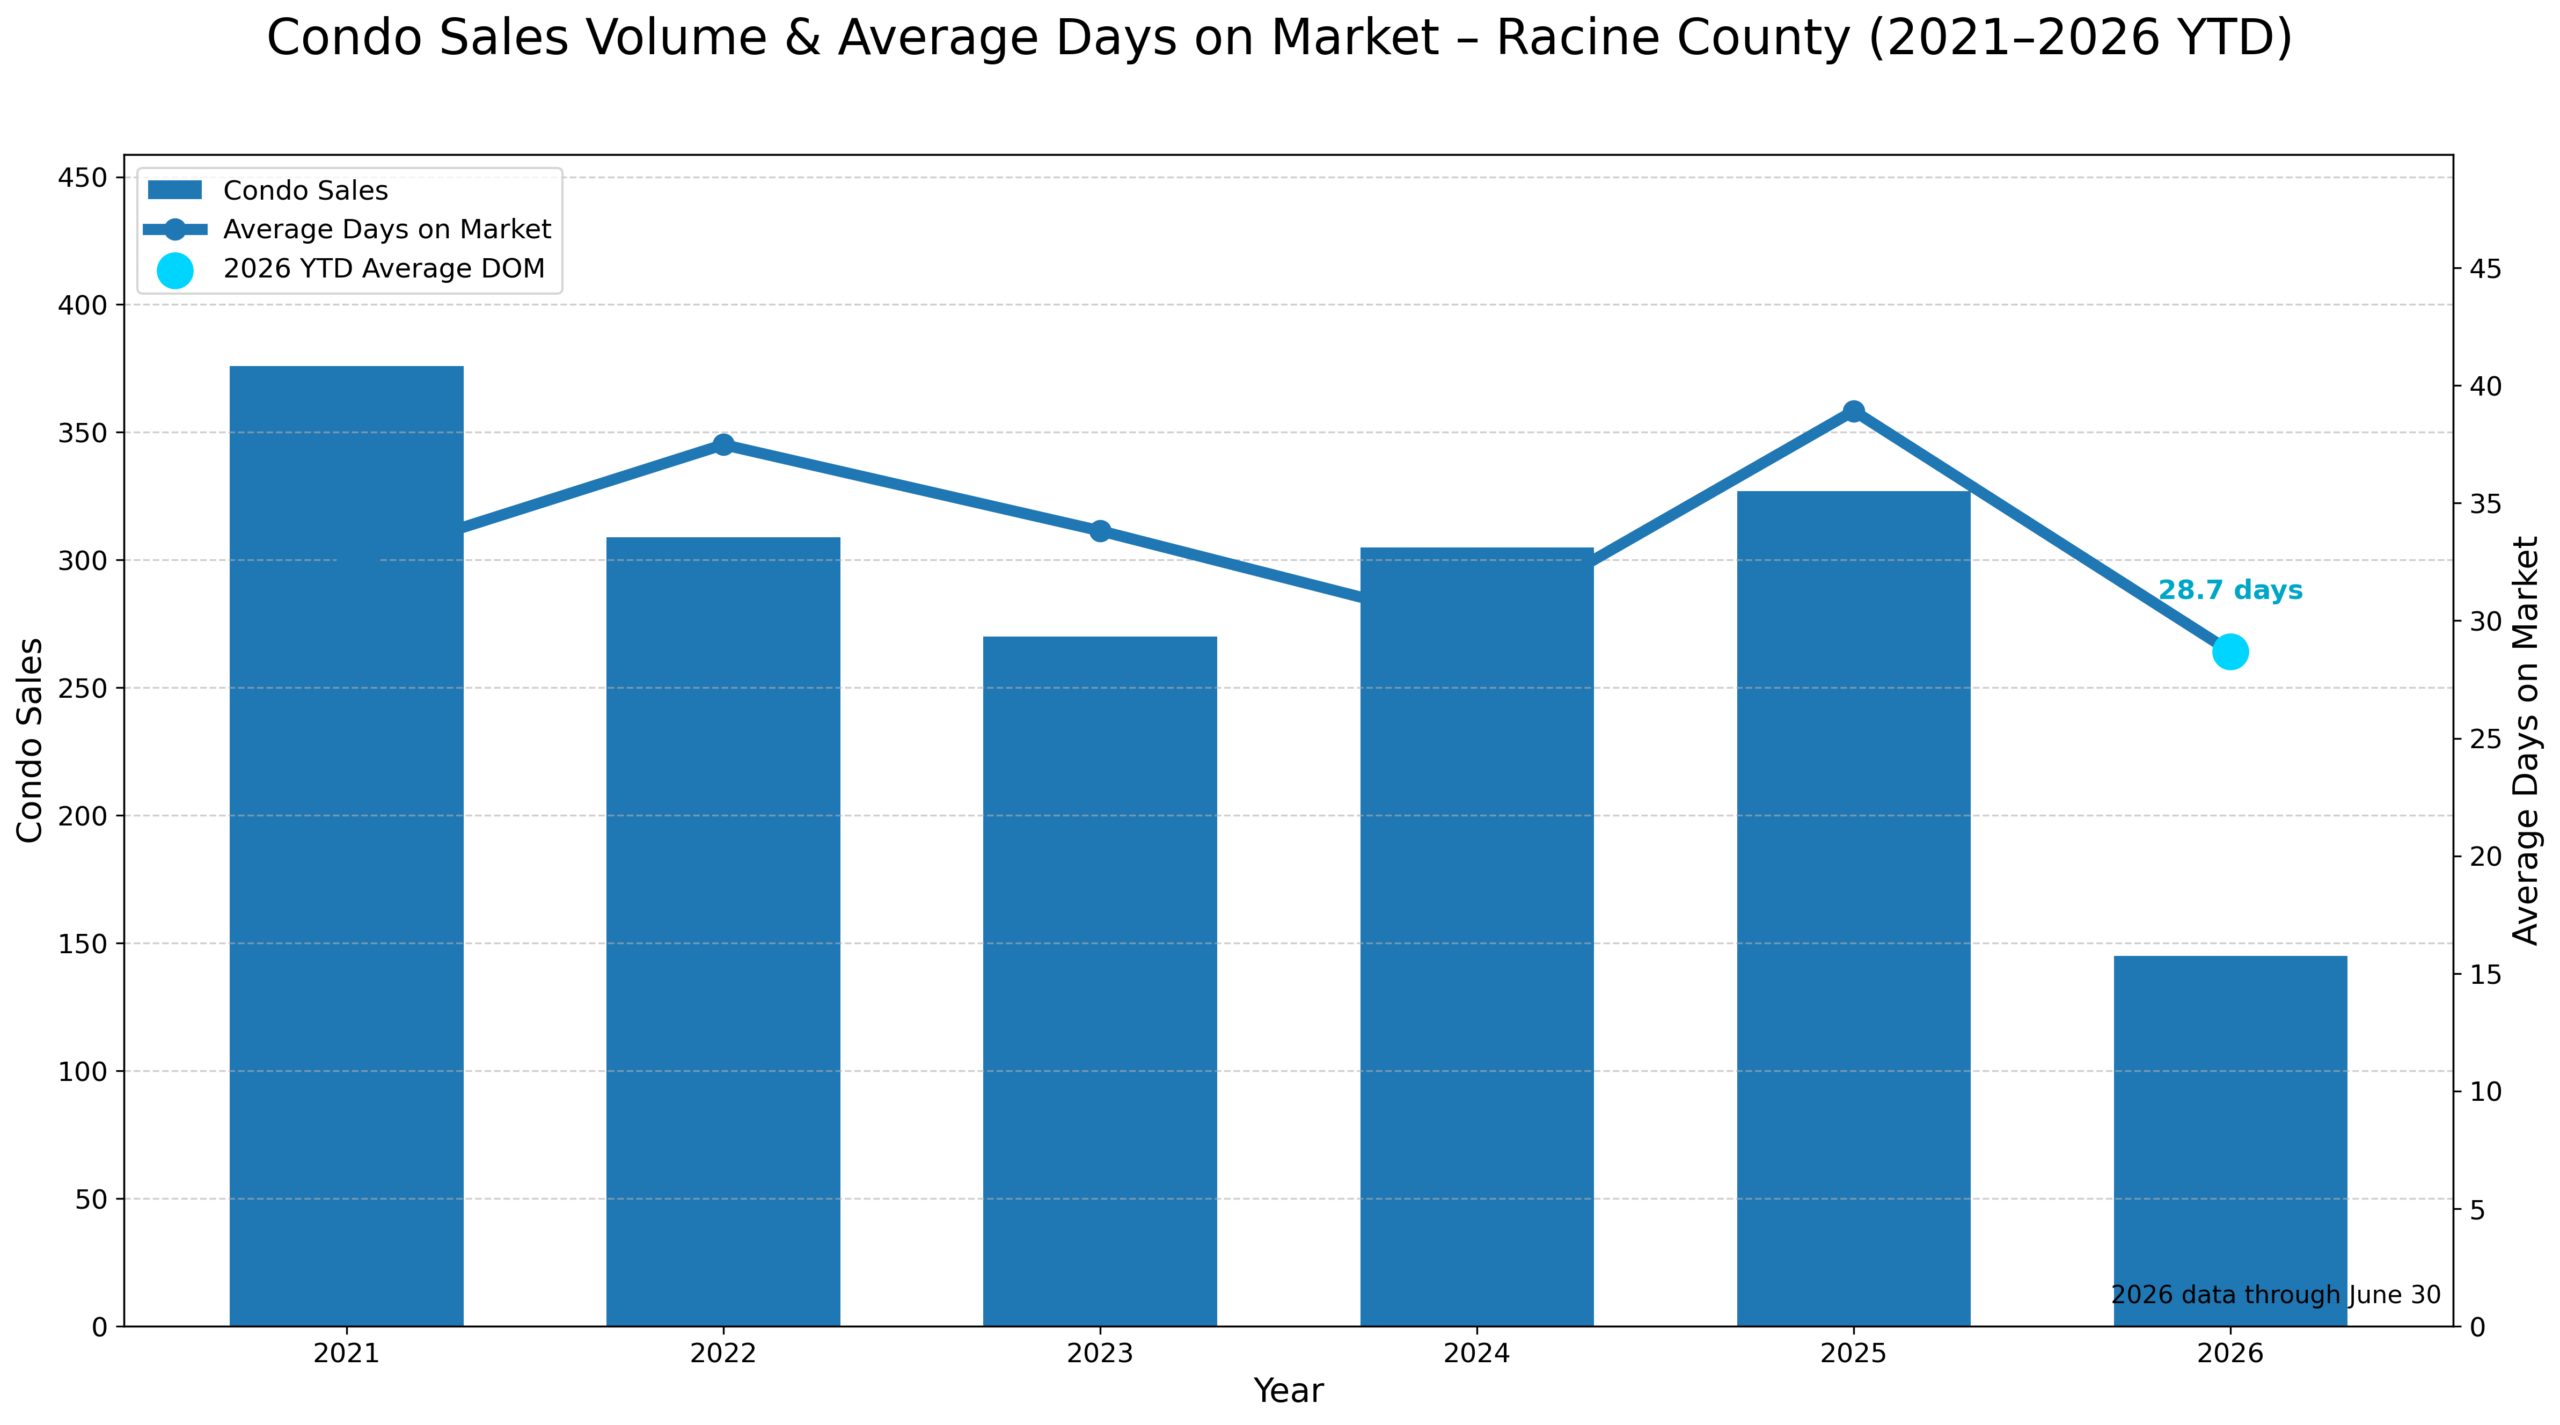
📊 Closings: 145
🔻 11 fewer than mid-year 2025
🔺 Still more than the first-half totals recorded in 2022, 2023 and 2024

💸 Median List Price: $259,900
🔻 Down $15,100 from mid-year 2025
📍 Closely aligned with the $255,000 median sold price

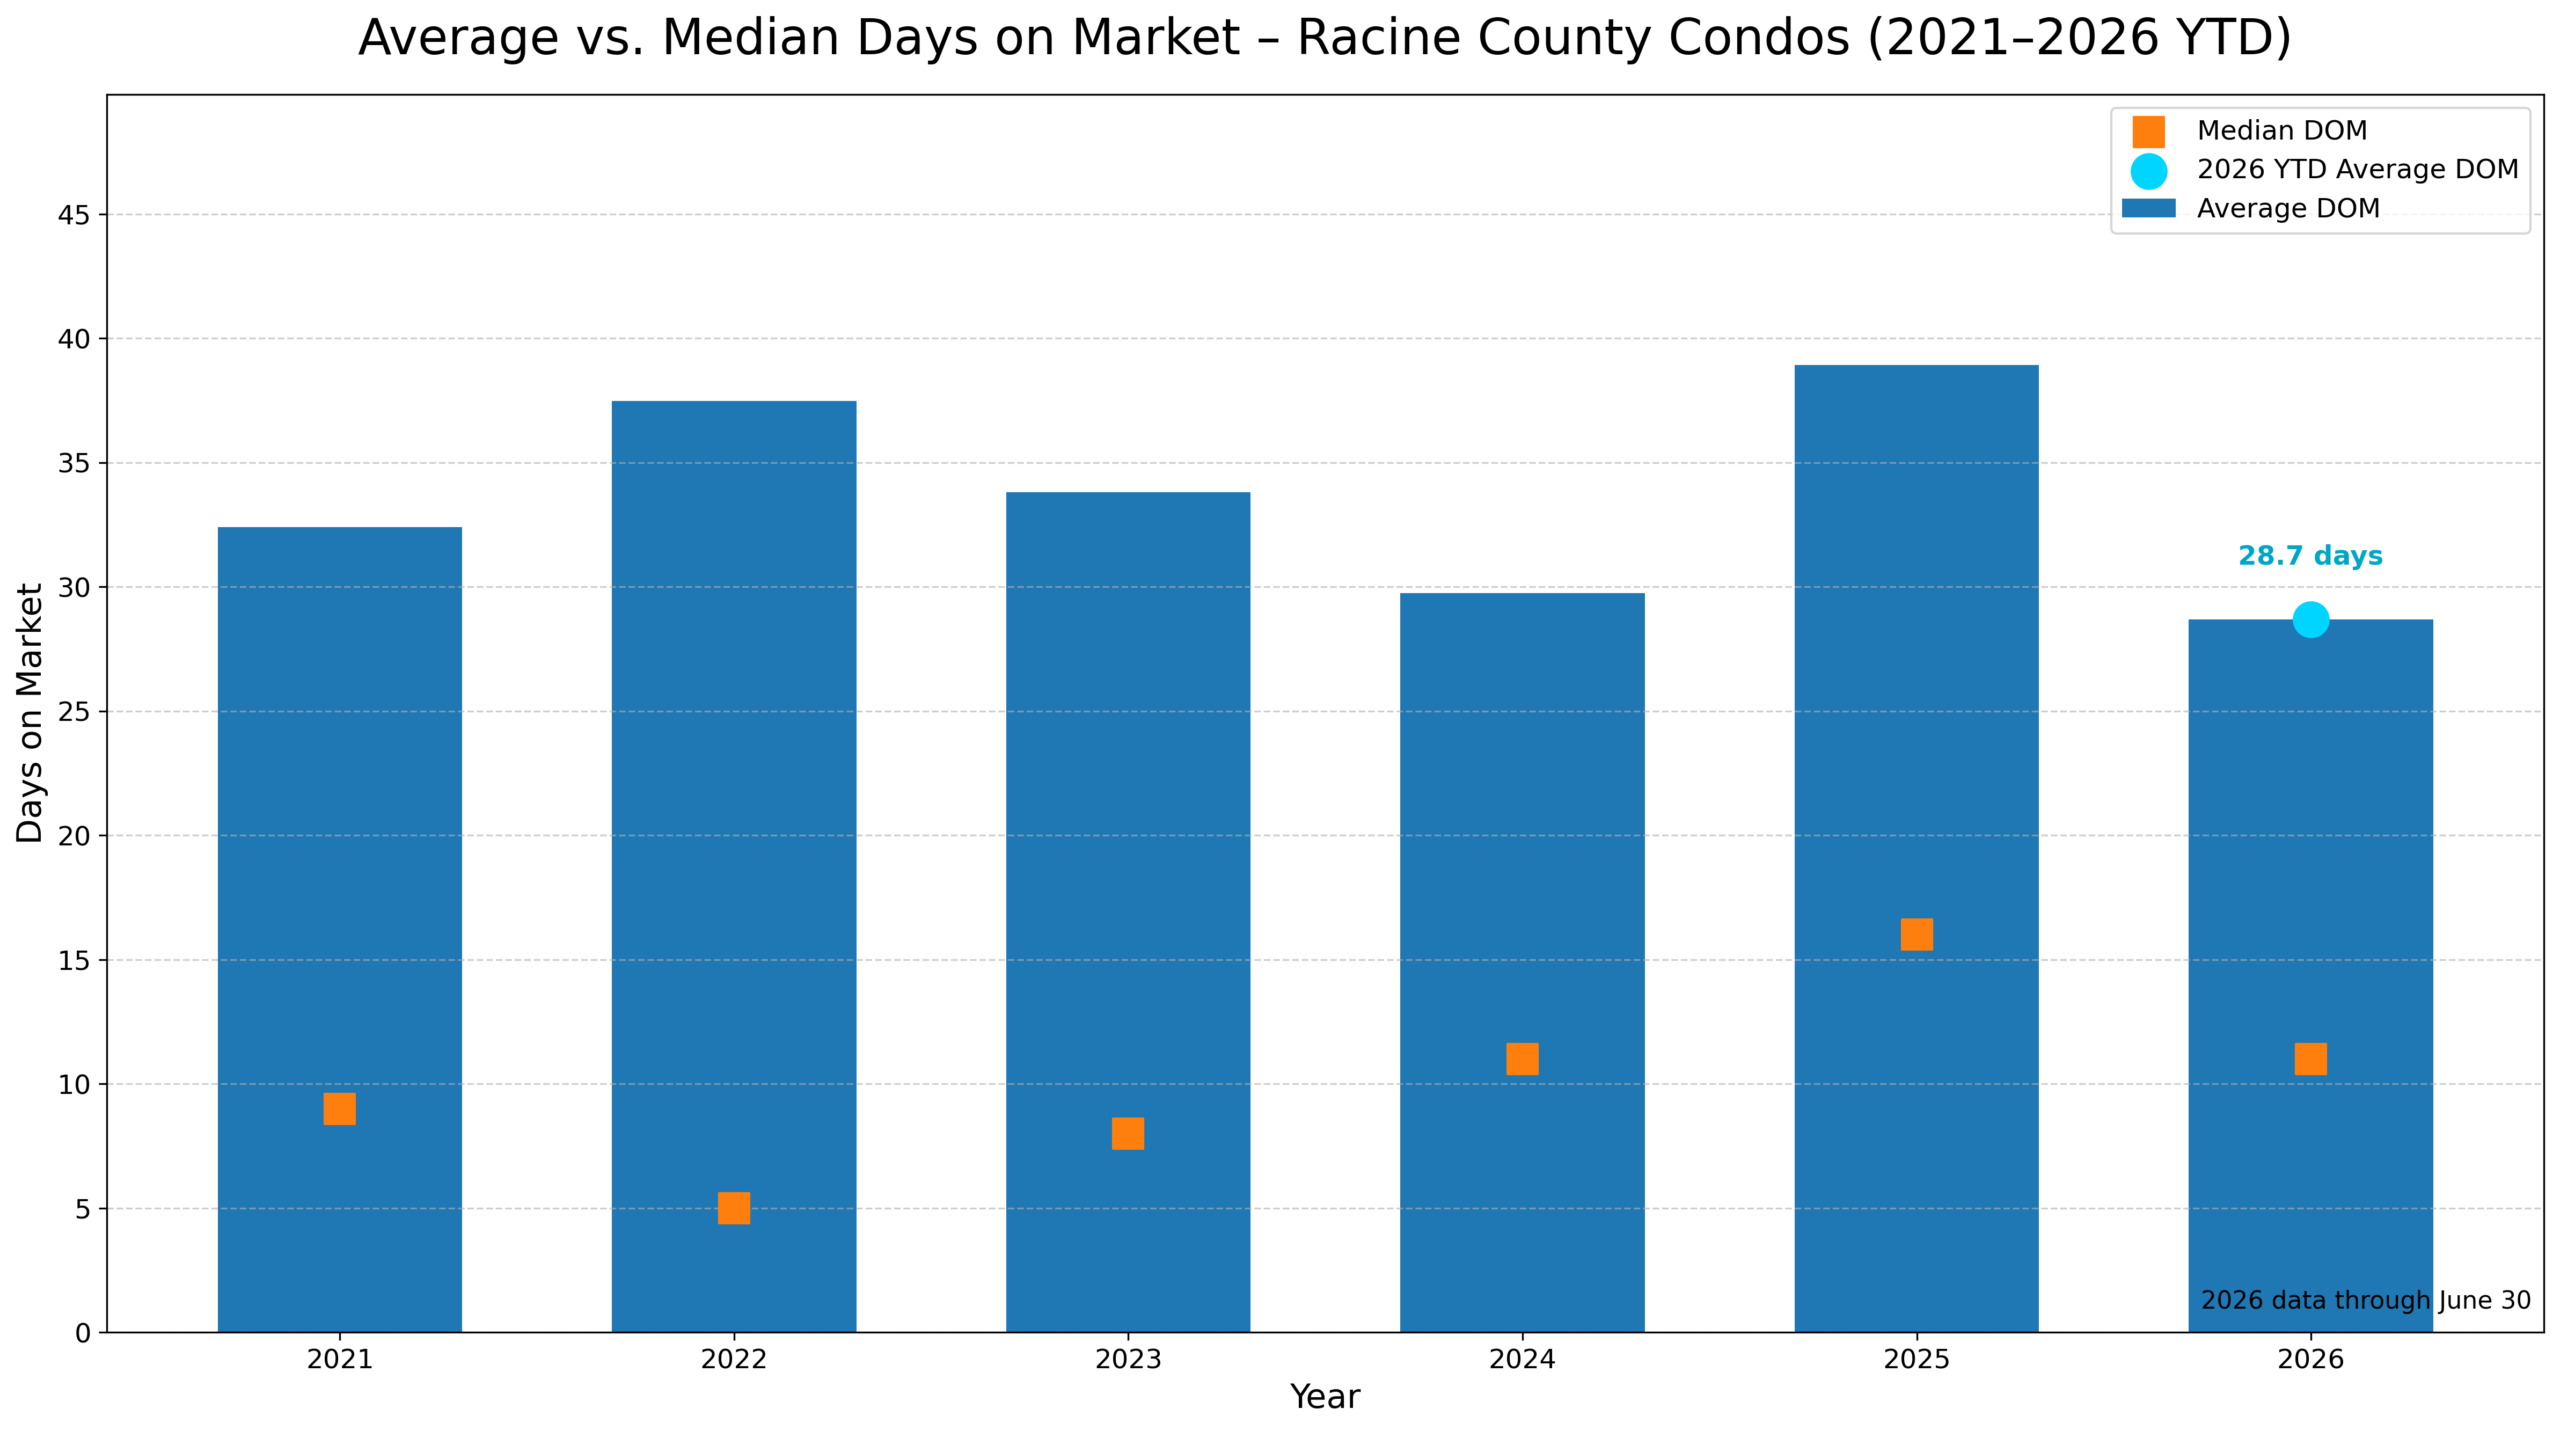
Median Days on Market: 11 days
⬇️ 4 days faster than mid-year 2025

📉 Average Days on Market: 28.7 days
⬇️ Nearly 12 days faster than last year
🏃 Fastest first-half average since 2024

📍 The bigger picture:
Racine County condo prices stepped back from the sharp gains seen in 2025, but the typical property actually sold faster. Of the 145 first-half sales, 68 closed below list price, 39 sold at list price and 38 finished above asking.

Racine County condo prices cooled in 2026 — but buyers remained active and decisive.

#RacineCounty #RacineWI #CondoMarket #MidYearReport #WisconsinCondos #CondoSweetCondo

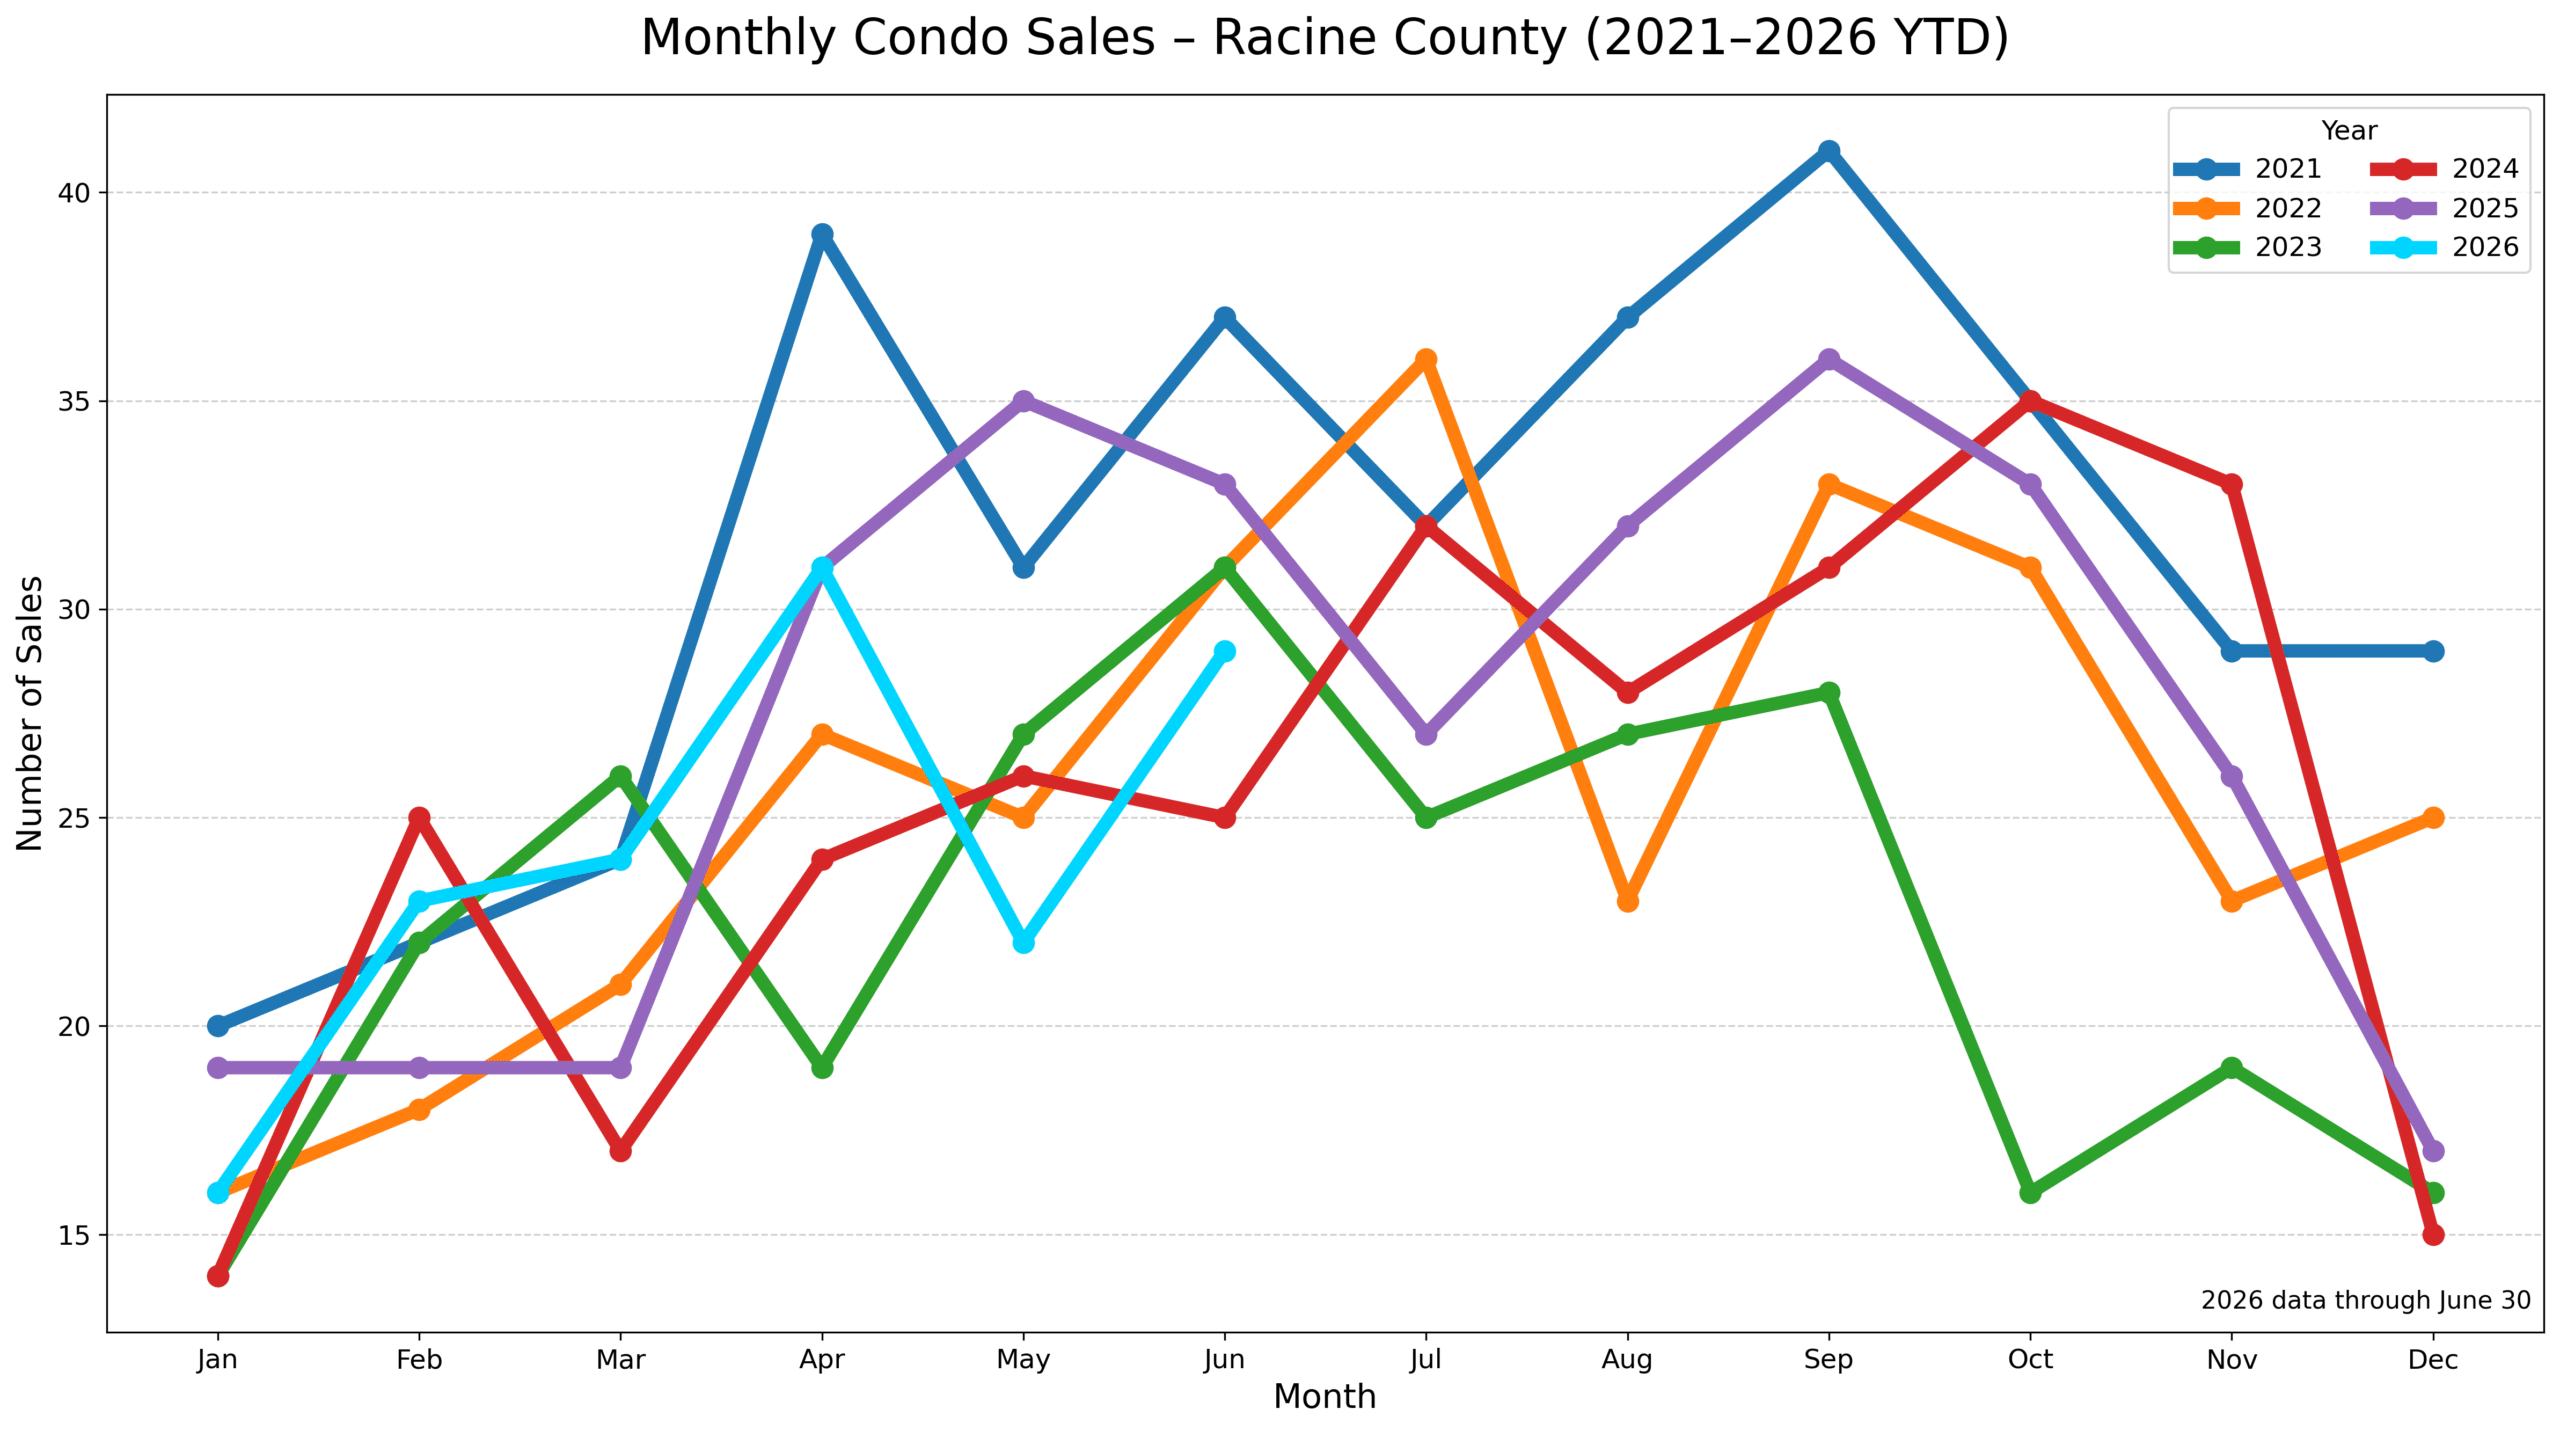
Racine County Monthly Condo Sales
Racine County Condo Average vs Median Days on Market
Racine County Condo Average vs Median Sold Price
Racine County Condo Sale-to-List Price Ratio
Racine County Condo Sales Volume & Average Days on Market
Racine County Condo Sold Price Distribution

About the Data and Charts

The information shown on this page is based on reported MLS/WIREX sales data. The list price reflects the starting price associated with the property’s most recently reported MLS listing contract. It may not reflect price changes made later under that same listing contract.

Days on market may be calculated differently by each local MLS. Differences in MLS rules, listing histories, relisting practices and data reporting may affect comparisons.

These charts are intended to provide a general overview of market activity and should not be relied upon as a substitute for property-specific research. When a particular sale, price, listing history or market statistic is important to your decision, please ask a licensed real estate agent to verify the underlying MLS information.

Sold Price Distribution Chart

The sold-price distribution chart uses violin shapes to show where sale prices were most concentrated during each year.

  • Wider sections indicate a greater concentration of sales within that price range.
  • Each violin’s overall width is scaled according to the number of sales reported for that year.
  • The visible price range is capped at the 97th percentile so a small number of unusually high sales do not compress the main portion of the chart.
  • The internal lines identify the lower quartile, median and upper quartile.
  • Bright cyan identifies 2026 year-to-date data through June 30.

Rotate Tablet or Phone for Graph Below Showing Priced Reduced Count for Homes in Racine County

 Share this information with friends? or bookmark our page for yourself.

Facebook
Twitter
LinkedIn

Because, “www.Wisconsin.condos. Targeted focus. Better Results.” Ask us how.

Buying or Selling? at 262-238-3900 for a free, no commitment, conversation.

Follow our Racine Condo Facebook blog below

Comments Box SVG iconsUsed for the like, share, comment, and reaction icons

One number that jumped out at me: Wisconsin at 7%.

That’s the share of mortgages that were FHA as of Q2 2025, according to New York Fed data this puts Wisconsin among the lowest states shown on this map.

Quite a contrast with parts of the South, where FHA makes up 15%–22% of mortgages.

📊 Source: New York Fed Consumer Credit Panel / Equifax
Map: Lance Lambert / ResiClub
See MoreSee Less

One number that jumped out at me: Wisconsin at 7%.

That’s the share of mortgages that were FHA as of Q2 2025, according to New York Fed data this puts Wisconsin among the lowest states shown on this map.

Quite a contrast with parts of the South, where FHA makes up 15%–22% of mortgages.

📊 Source: New York Fed Consumer Credit Panel / Equifax
Map: Lance Lambert / ResiClub
Load more