Investment growth. Stable or flat lined, and is housing market trend to follow
Title: Flatline or Foundation? What Today’s Investment Trend Tells Us About the Market
For over a year, the line hasn’t moved much.
Since Q1 2023, U.S. private domestic investment has hovered near 4% growth each quarter. Not up, not down, it’s just steady. In the world of economics, this kind of flatline is rare. Not since the early 1990s have we seen such a prolonged period of narrow movement in private domestic investment data.
So, is this a sign of stability? Or stagnation?
Looking Back: When Investment Meant Momentum
To understand why this trend stands out, we have to rewind a bit.
From 1990 to 2010, historical economic growth was anything but flat. In that 20-year span, we witnessed economic expansion powered by major forces:
The post-Cold War boom and the rise of globalization
The internet and tech revolution
Relatively affordable housing and credit
Broad consumer optimism and upward mobility
Those years felt dynamic. New industries emerged, homeownership soared, and productivity gains gave the sense that each year brought new possibilities. Business leaders invested boldly in factories, infrastructure, and innovation.
In contrast, today’s steadiness feels muted. The numbers may look fine on paper, but they don’t inspire the same excitement.
Why Investment Might Be Holding Back
Several weighty factors may be holding down the desire to invest aggressively today:
High interest rates make borrowing expensive
Geopolitical tensions, like the war in Ukraine and rising instability in Asia, cloud long-term forecasts
Sticky inflation in housing, insurance, and energy costs strains business planning
Consumers are cautious, despite wage gains, due to cost-of-living concerns
Regulatory and tax uncertainty as we approach another national election (all 435 House of Reps and more)
It’s not just that investment growth is flat, it’s that many companies appear to be waiting. Watching. Not shrinking, but not stretching either.
What This Means for Real People
You may not think much about U.S. investment trends when you’re buying groceries or considering a home purchase. But behind the scenes, these trends shape:
Job opportunities
Mortgage rate trends
Housing supply and development
Consumer product innovation
Recent housing market data suggests that even as 2024 continues to unfold, revised forecasts now show that 2025 unit sales may fall below 2024 levels. This points to ongoing hesitation in both buyers and sellers, further echoing the larger pattern of cautious, measured activity in the real estate market. It’s yet another example of how housing market trends mirror national economic investment patterns.
During the 1990s and early 2000s, many Americans experienced the trickle-down effect of rising investment. New neighborhoods were built. Tech jobs flourished. Local economies benefited from national confidence. when you’re buying groceries or considering a home purchase. But behind the scenes, these trends shape:
Job opportunities
Mortgage rate trends
Housing supply and development
Consumer product innovation
During the 1990s and early 2000s, many Americans experienced the trickle-down effect of rising investment. New neighborhoods were built. Tech jobs flourished. Local economies benefited from national confidence.
Today, the sentiment is different. Growth is happening, but it doesn’t always feel like it.
A Real Estate Perspective
As someone who tracks both macro data and micro trends, I find this chart to be revealing.
Housing market trends are deeply connected to broader economic shifts. When builders hesitate to break ground or buyers pull back due to economic uncertainty, it creates ripple effects in every neighborhood. Recognizing these real estate investment impacts is part of what I do.
Currently, the sub 350k market remains crazy strong for sellers. The statewide acceleration is slowing, and we are seeing cracks in the 450k-550k properties. (teasing my next nerd alert and FRED chart that I’m sensing)
Final Thought: Pause or Pivot?
The flatline we see in private investment could be temporary, a moment of recalibration before the next wave of growth. Or it could be a reflection of a new era: one where cautious optimism replaces bold bets.
Either way, understanding it matters.
If I’m this tuned in to national economic indicators, imagine the insight and strategy I can bring to your next home sale or purchase. Macro trends influence local outcomes, and my job is to help you navigate both with real estate advice you can trust.
Want to talk through how these trends could impact your next move? Since 1998 I’ve always been here to help. SAR
Facebook
Twitter
LinkedIn
Free support for a friend… Consider a share or like on my original post.
Scott Roh
920-707-0122
Wisconsin licensed real estate agent since 1998
First Weber, Inc
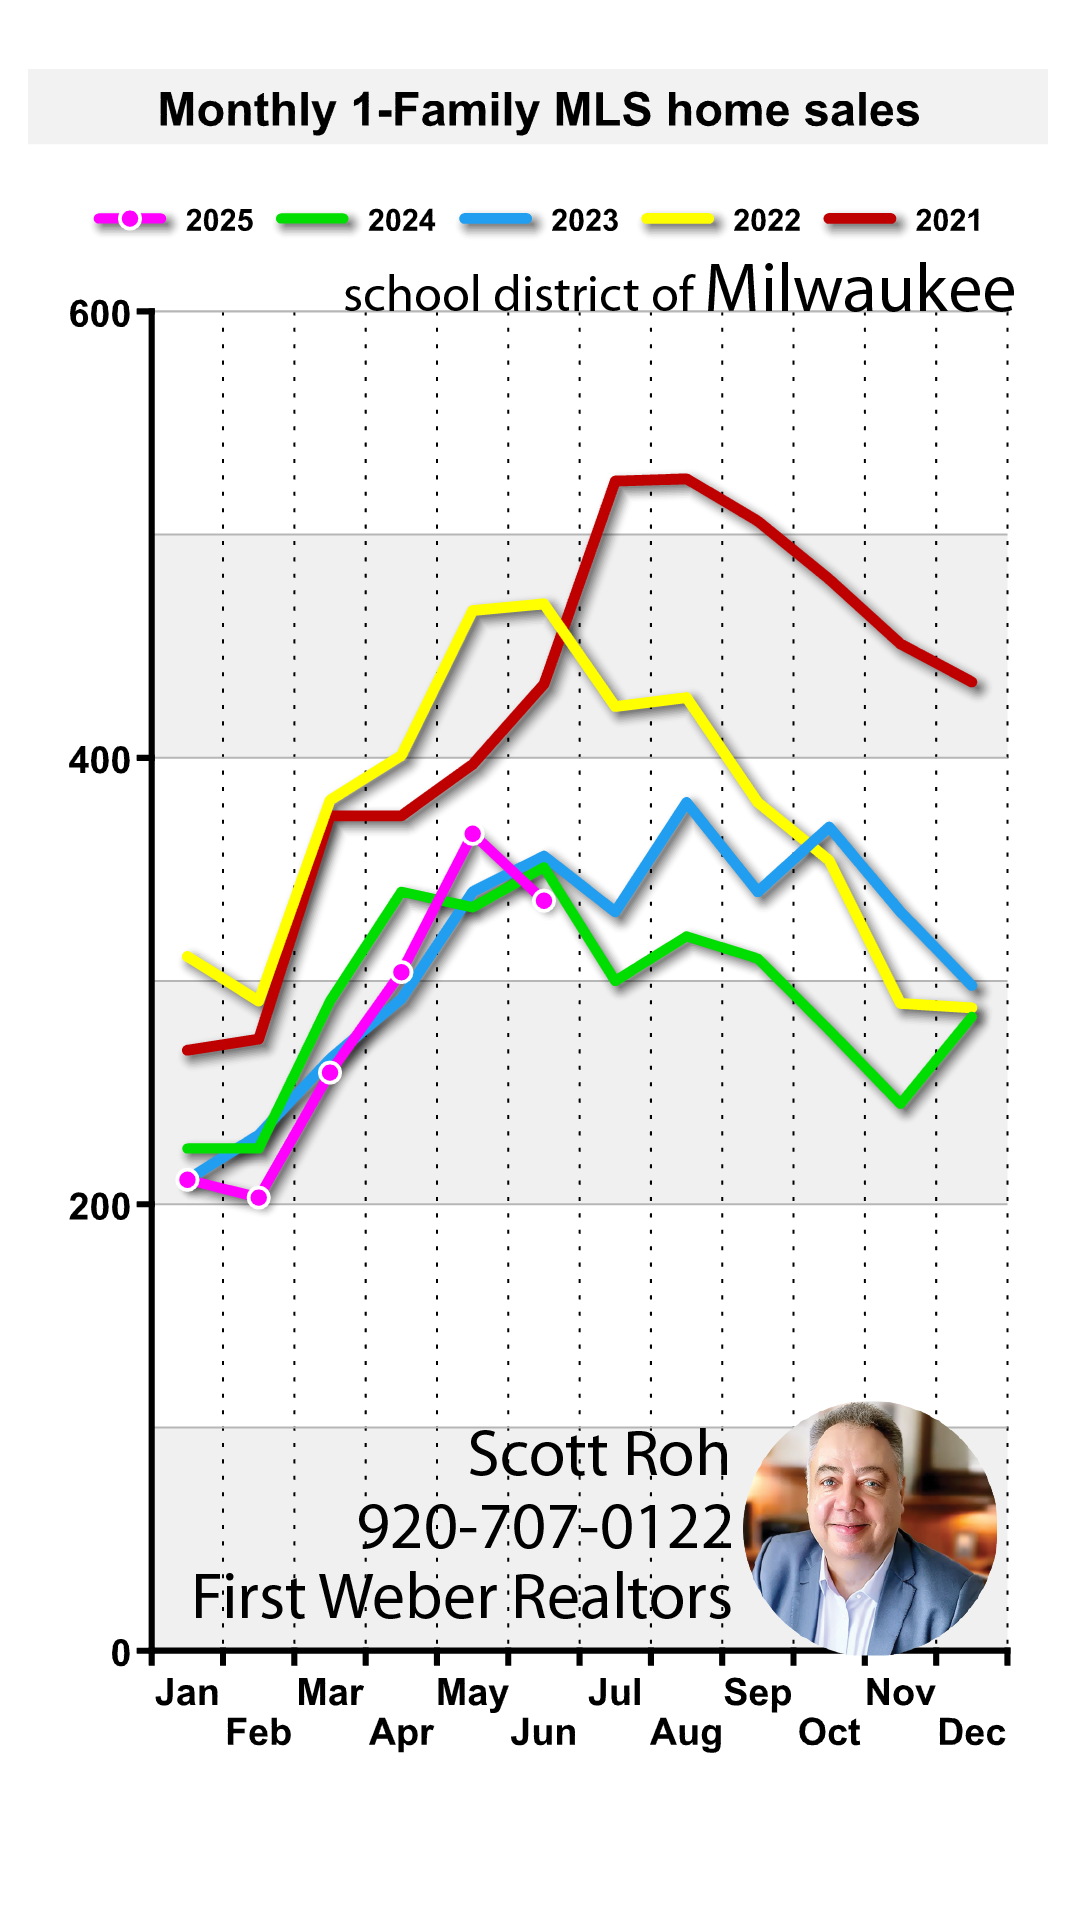
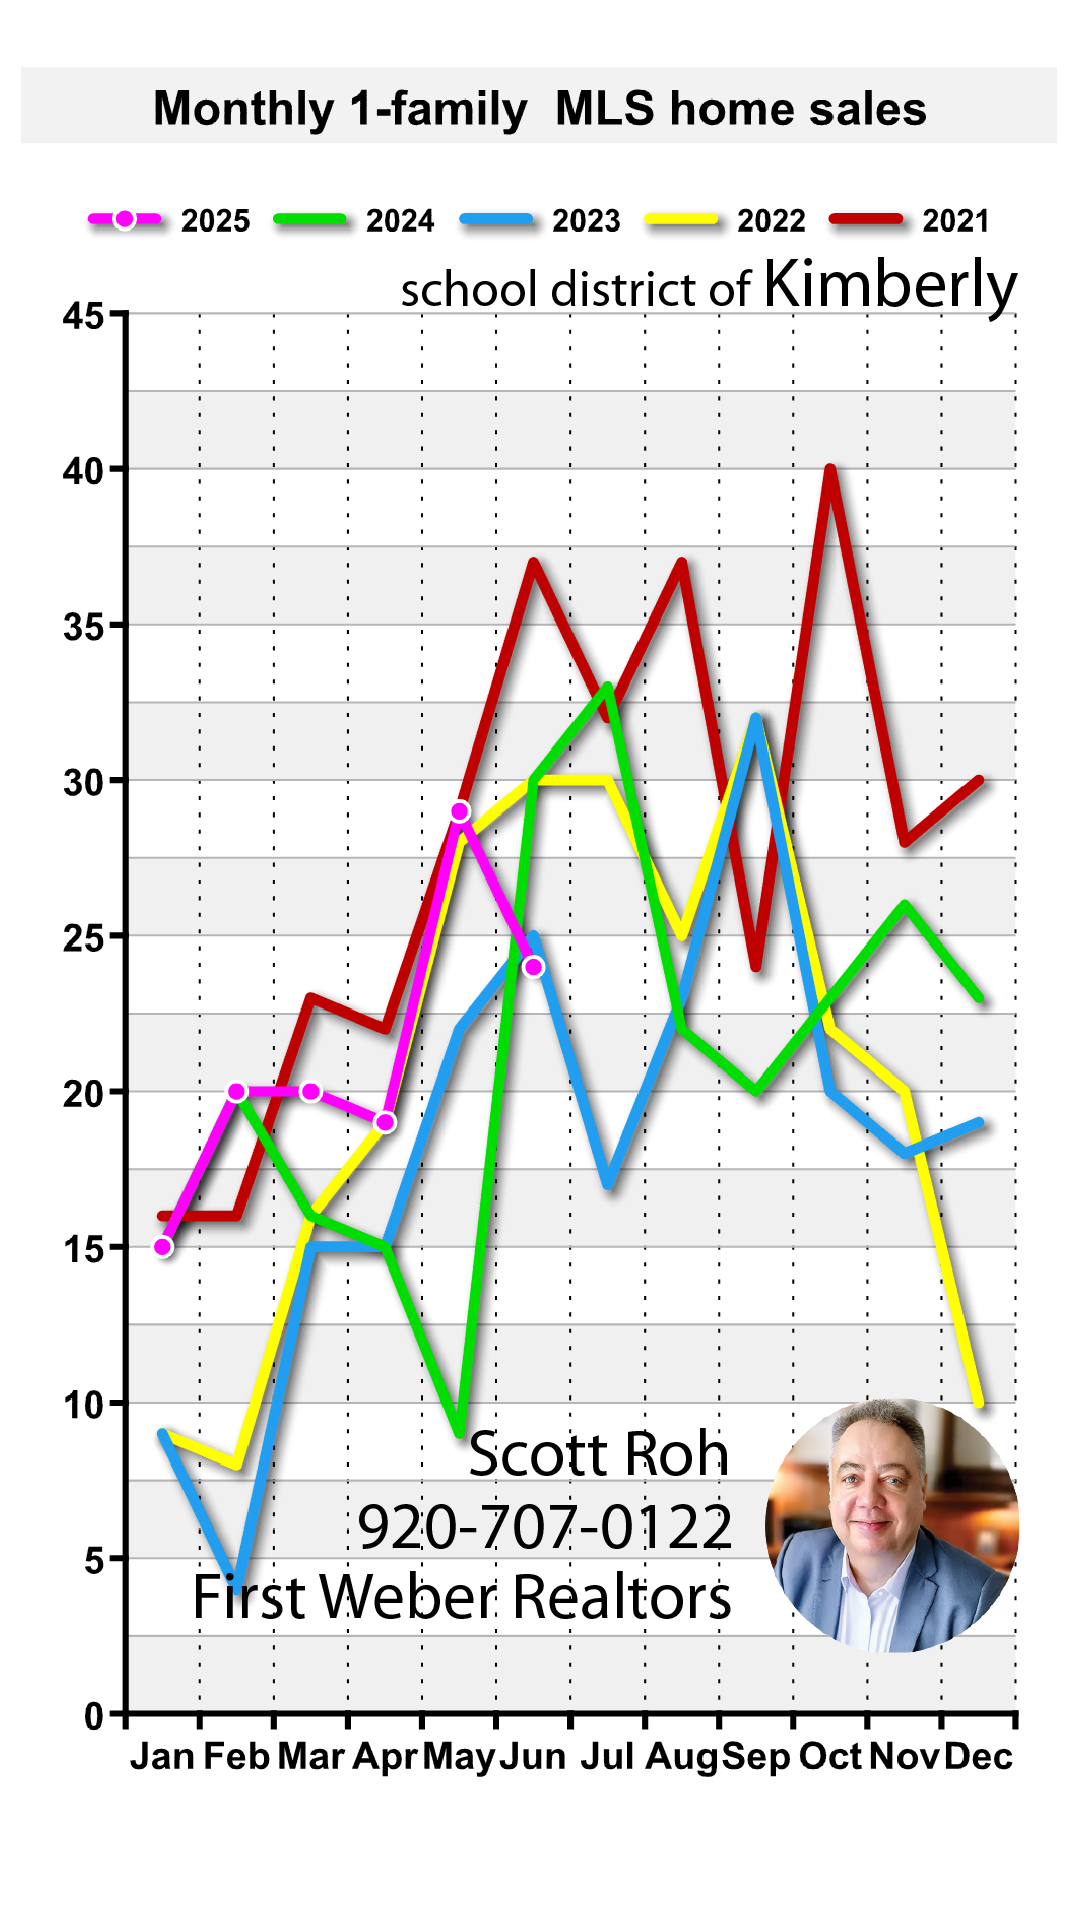
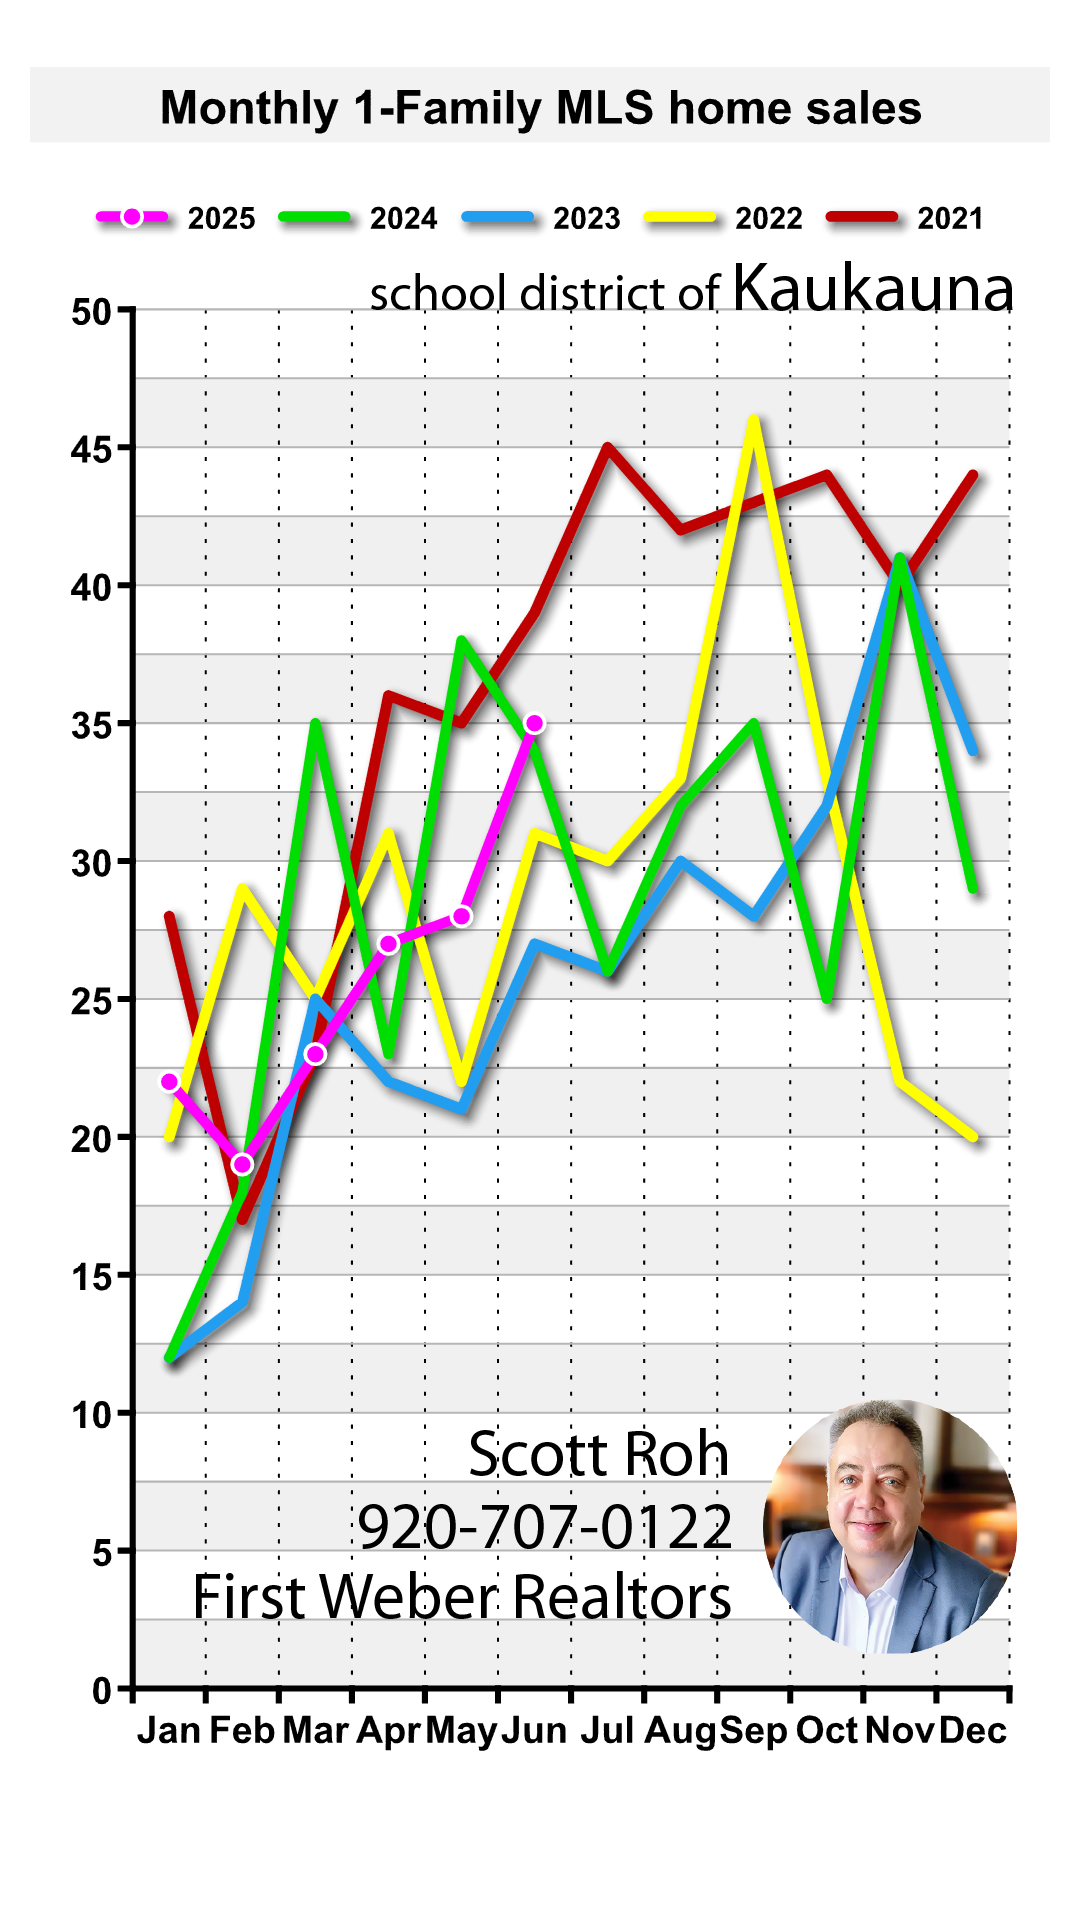
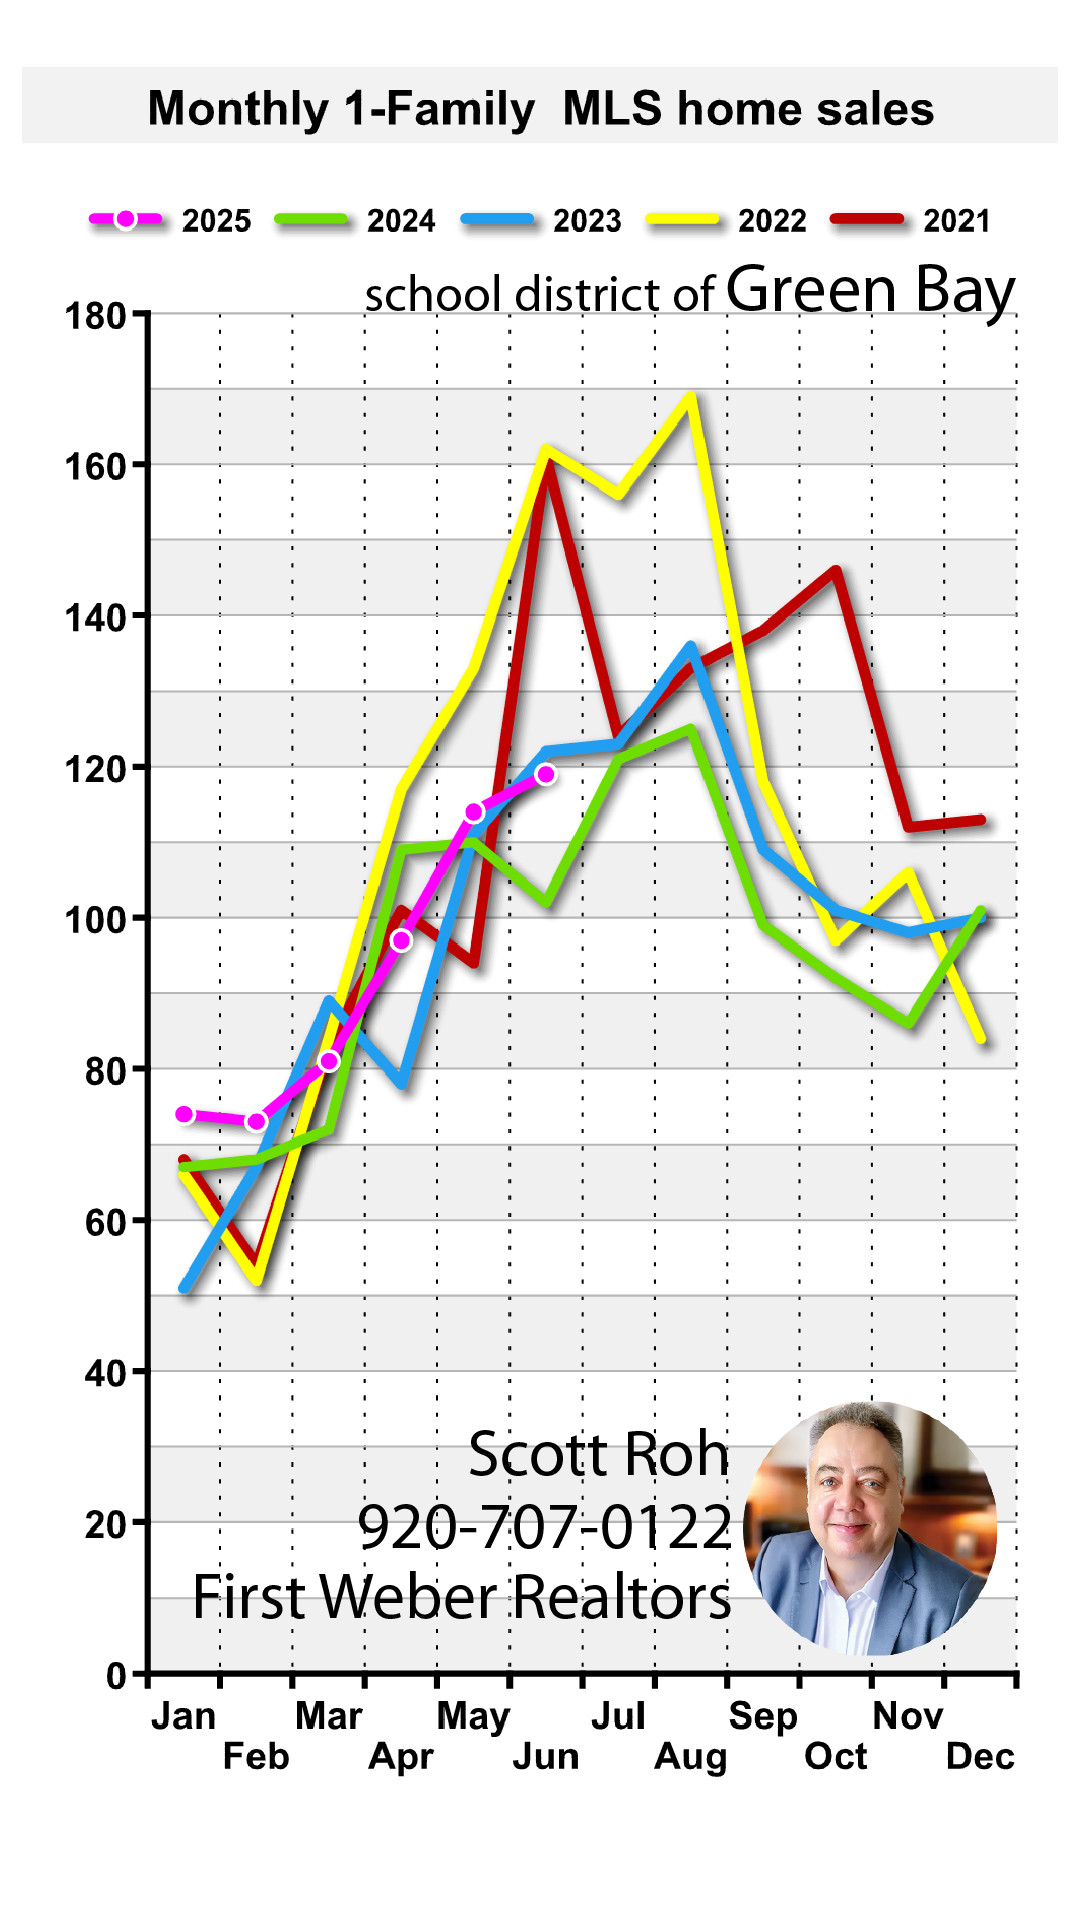
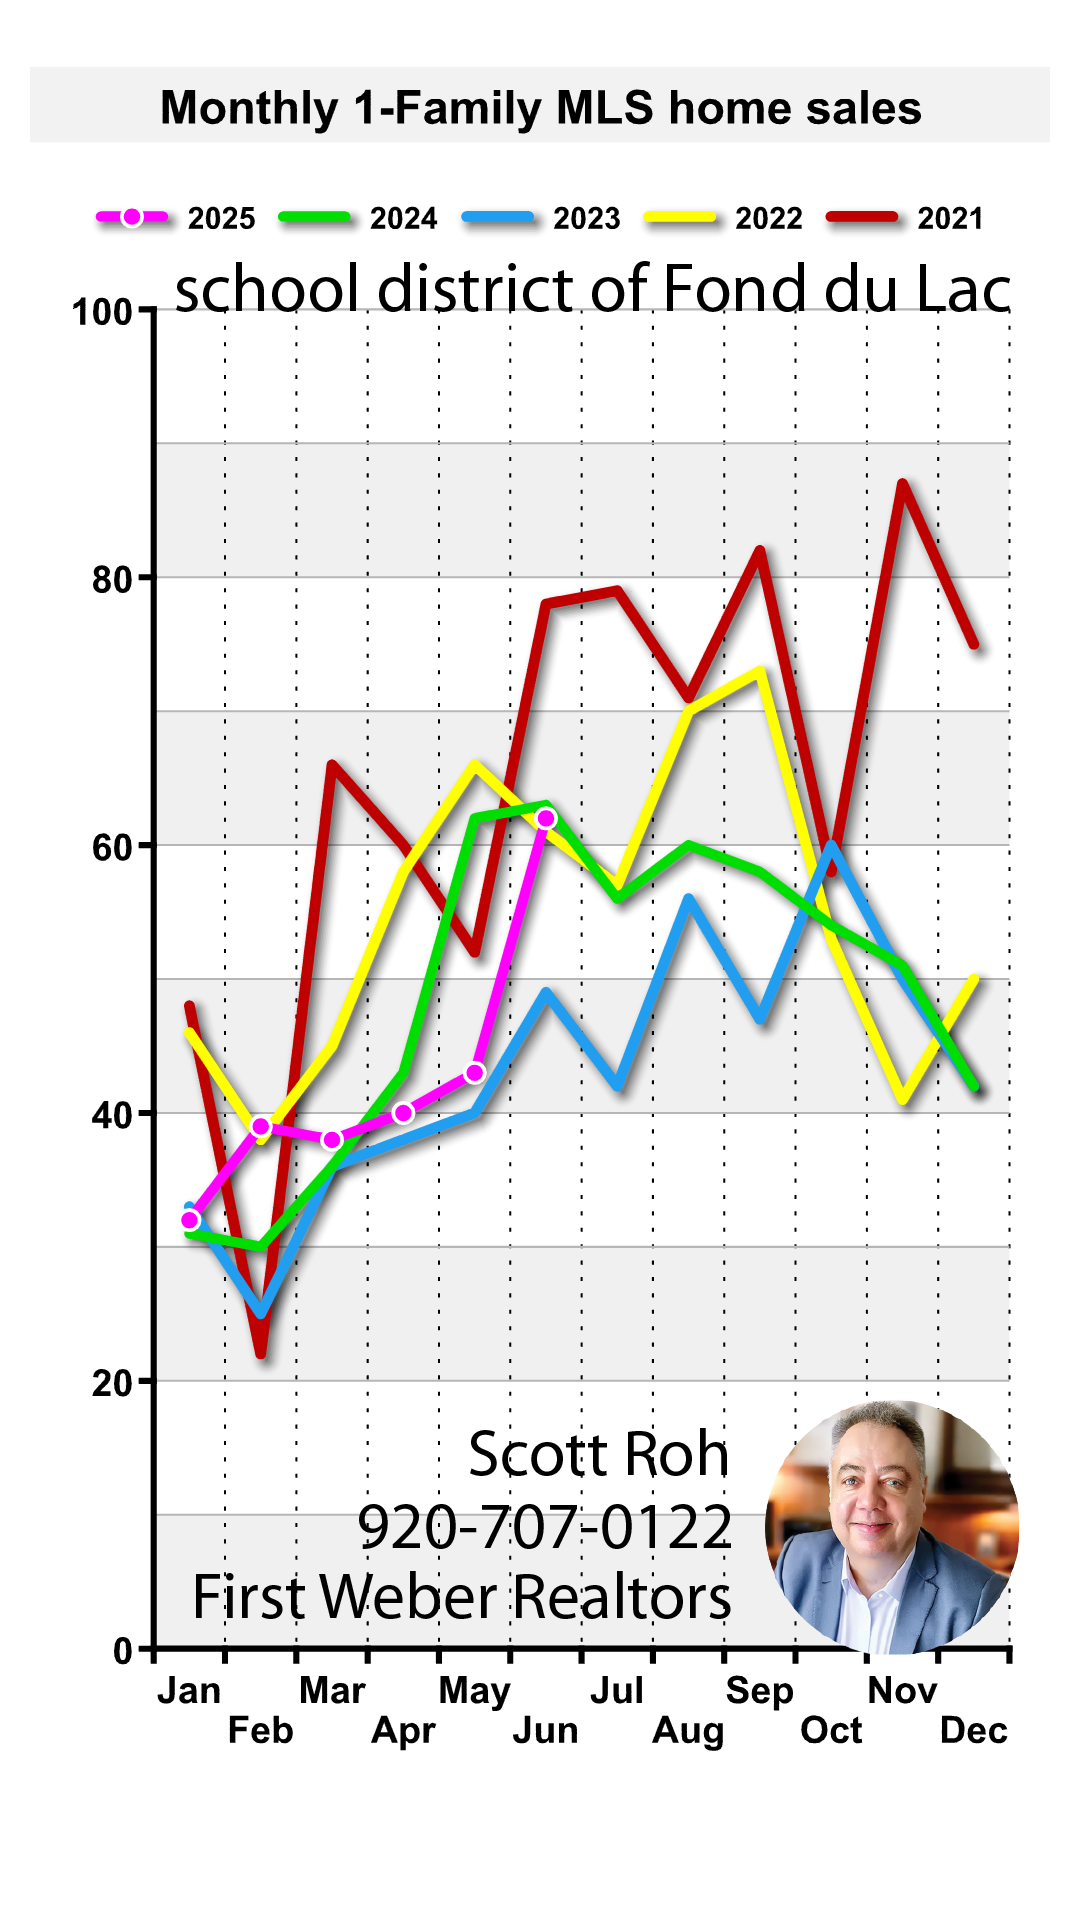
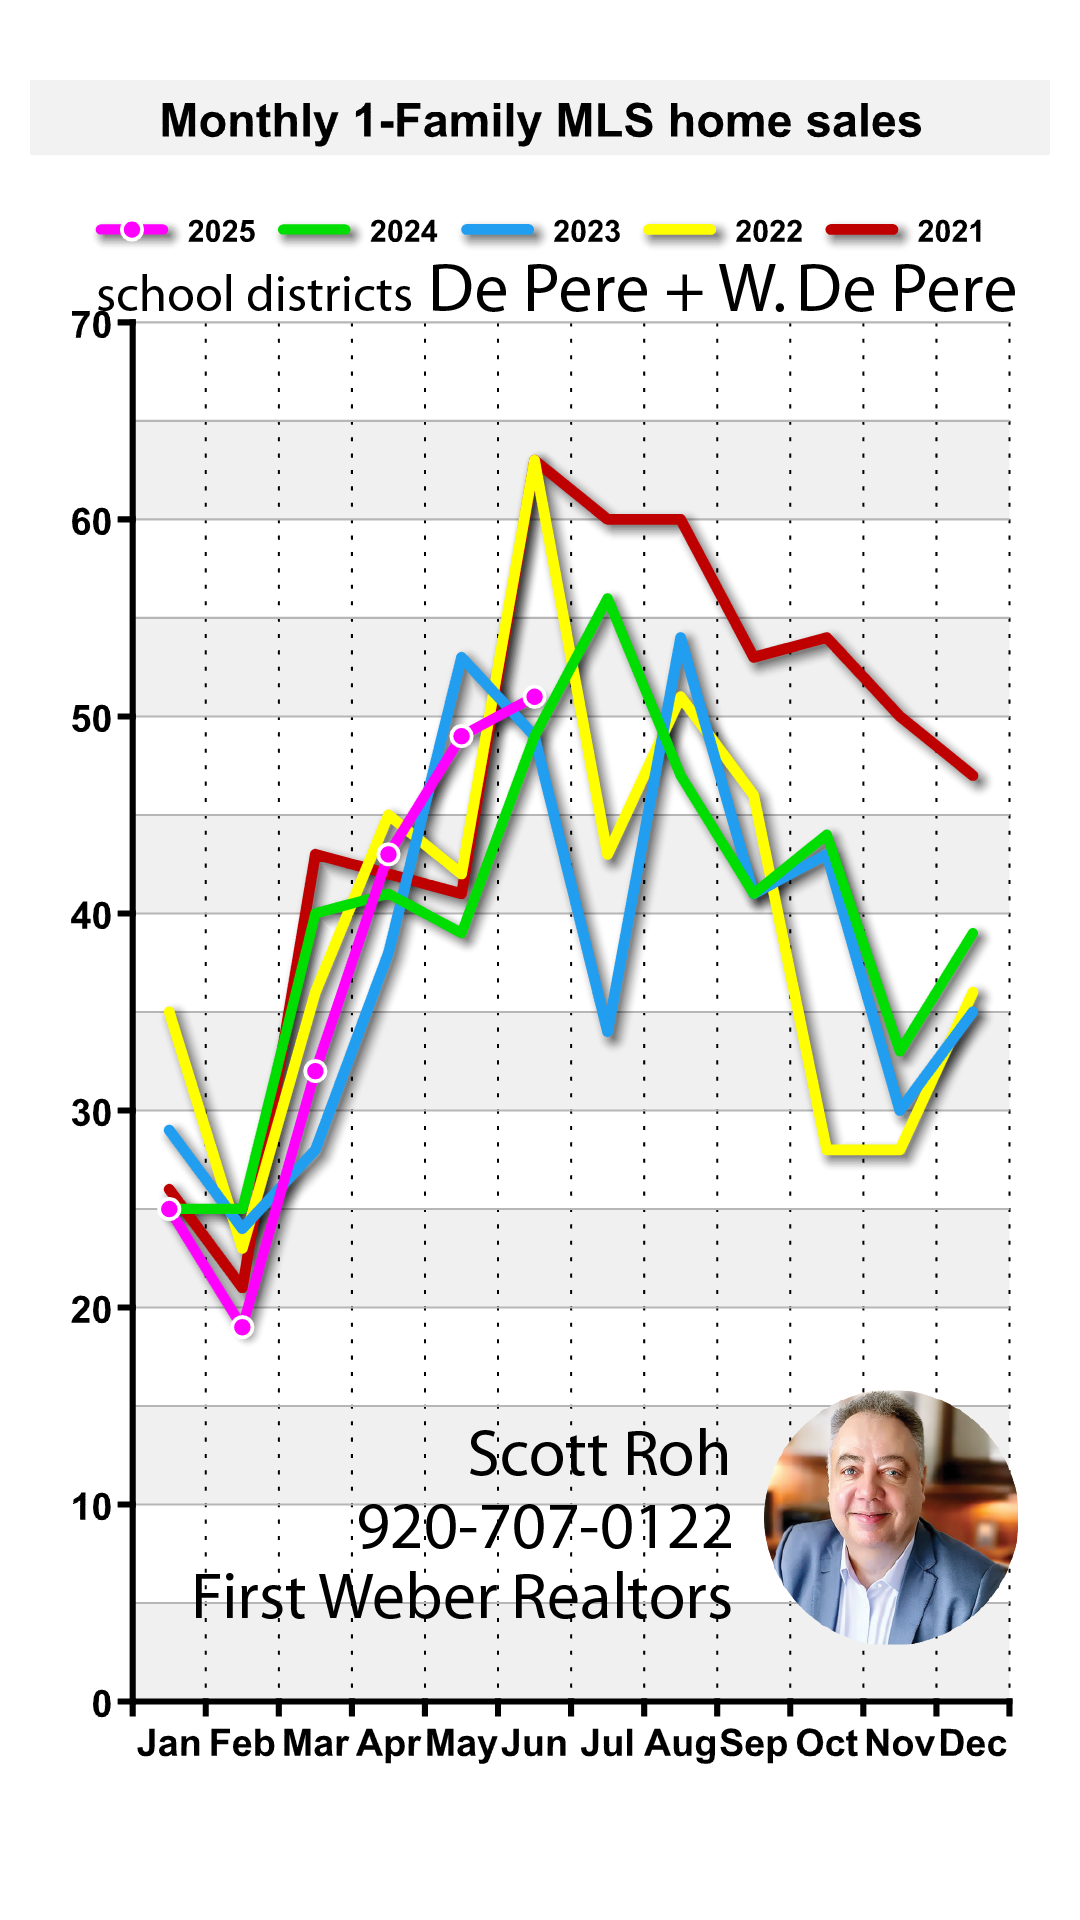
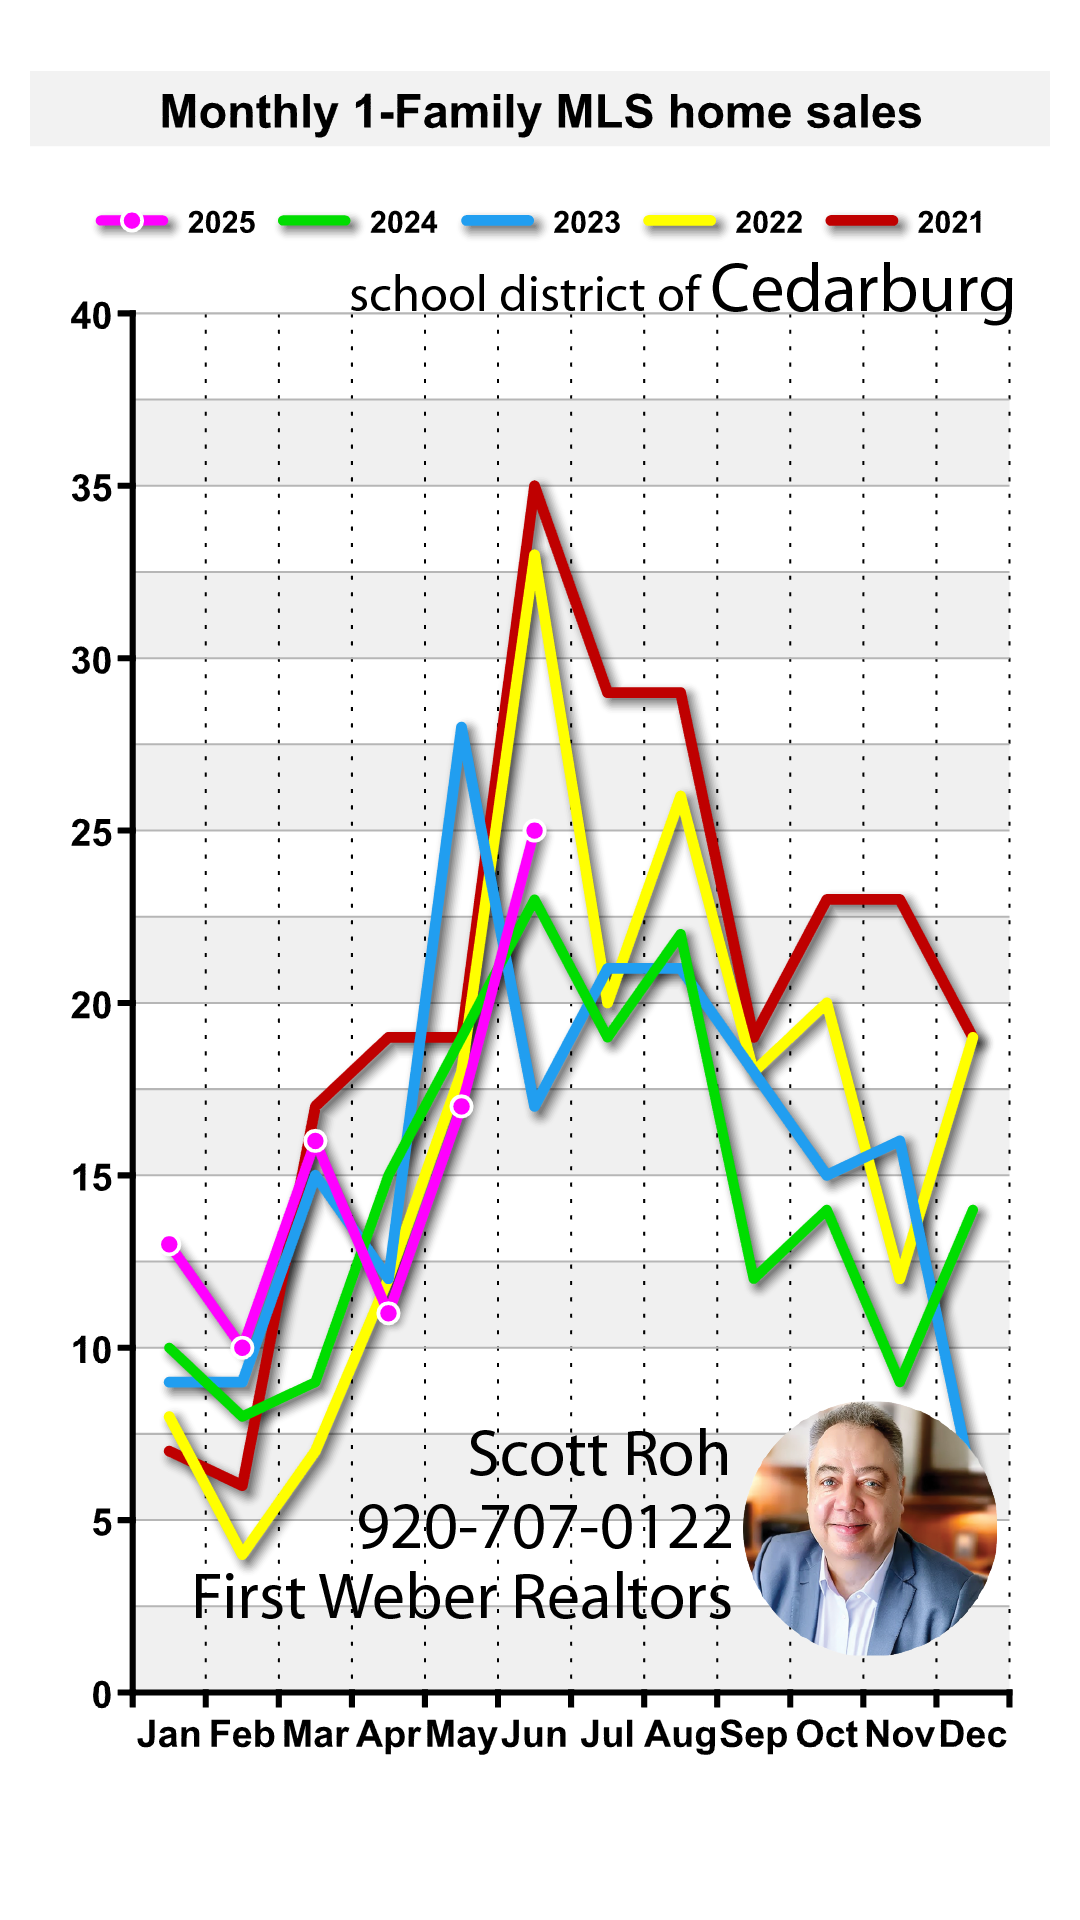
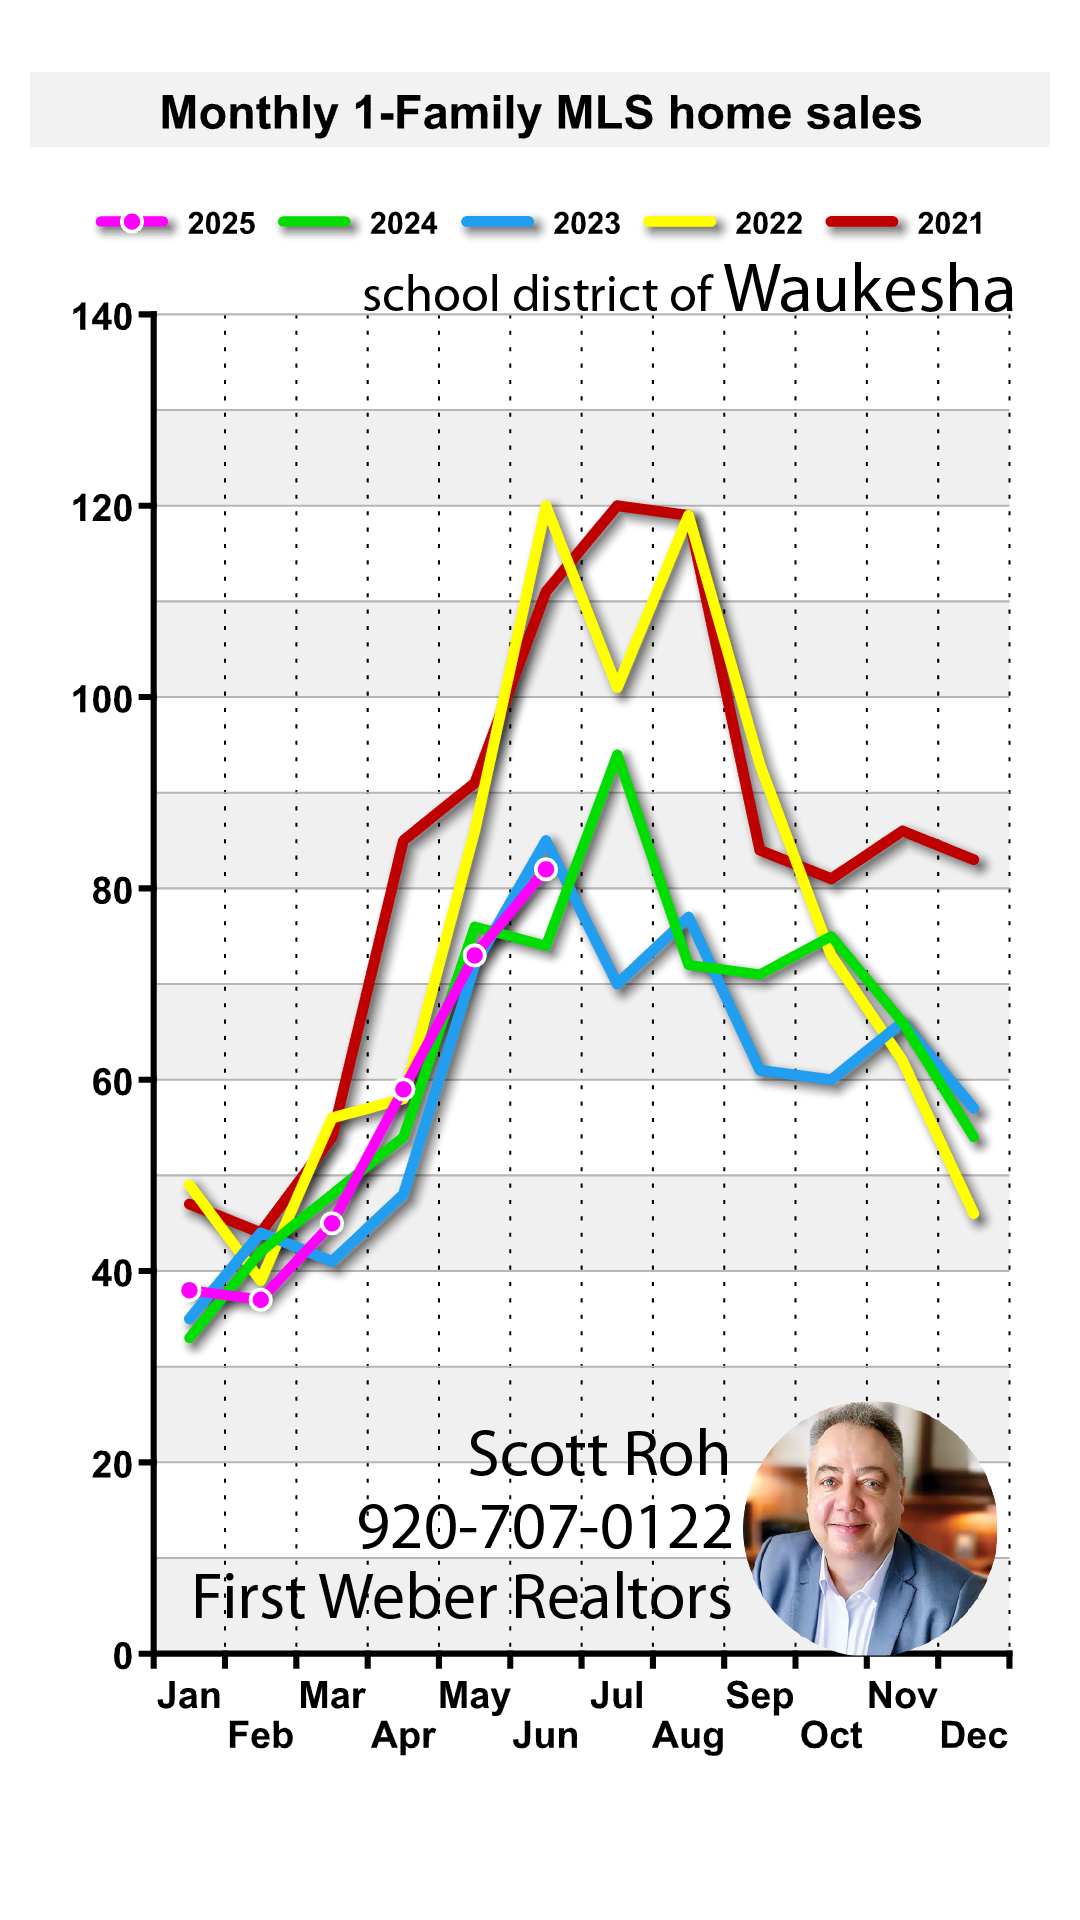
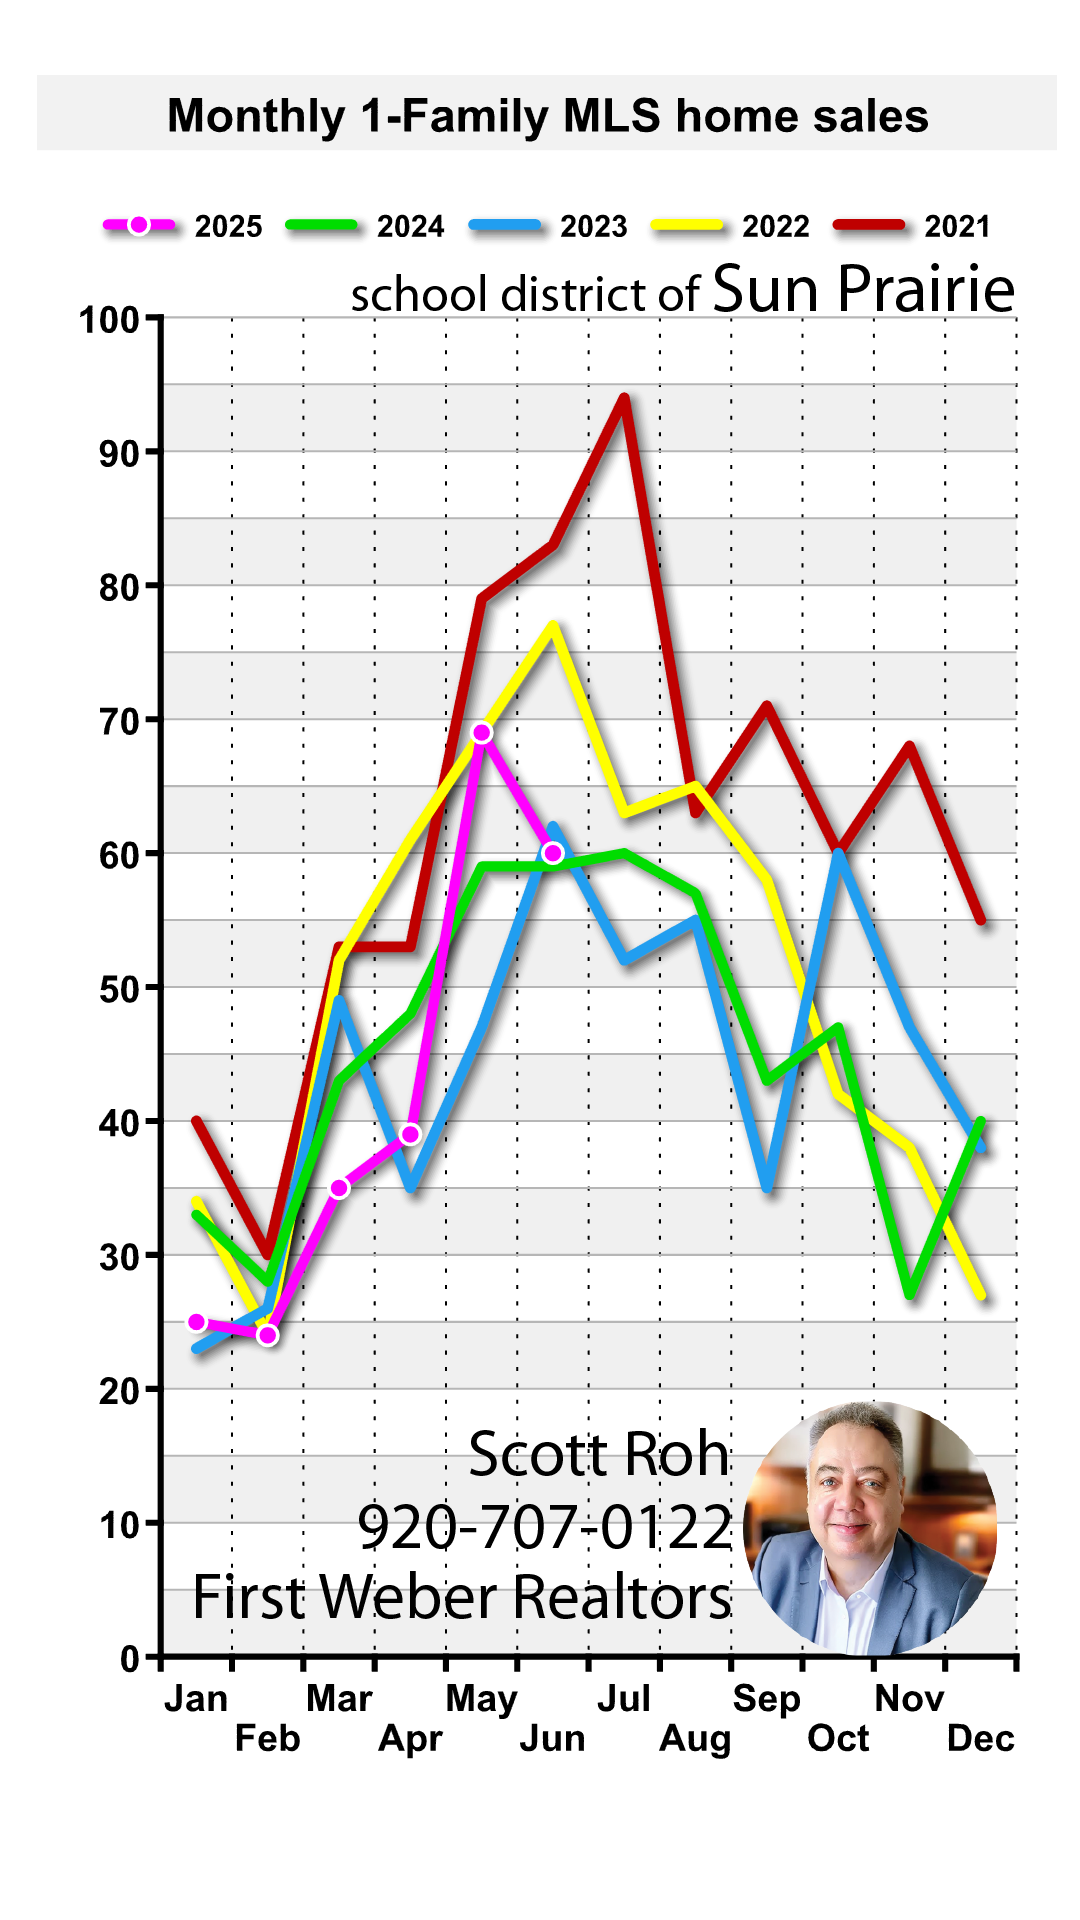
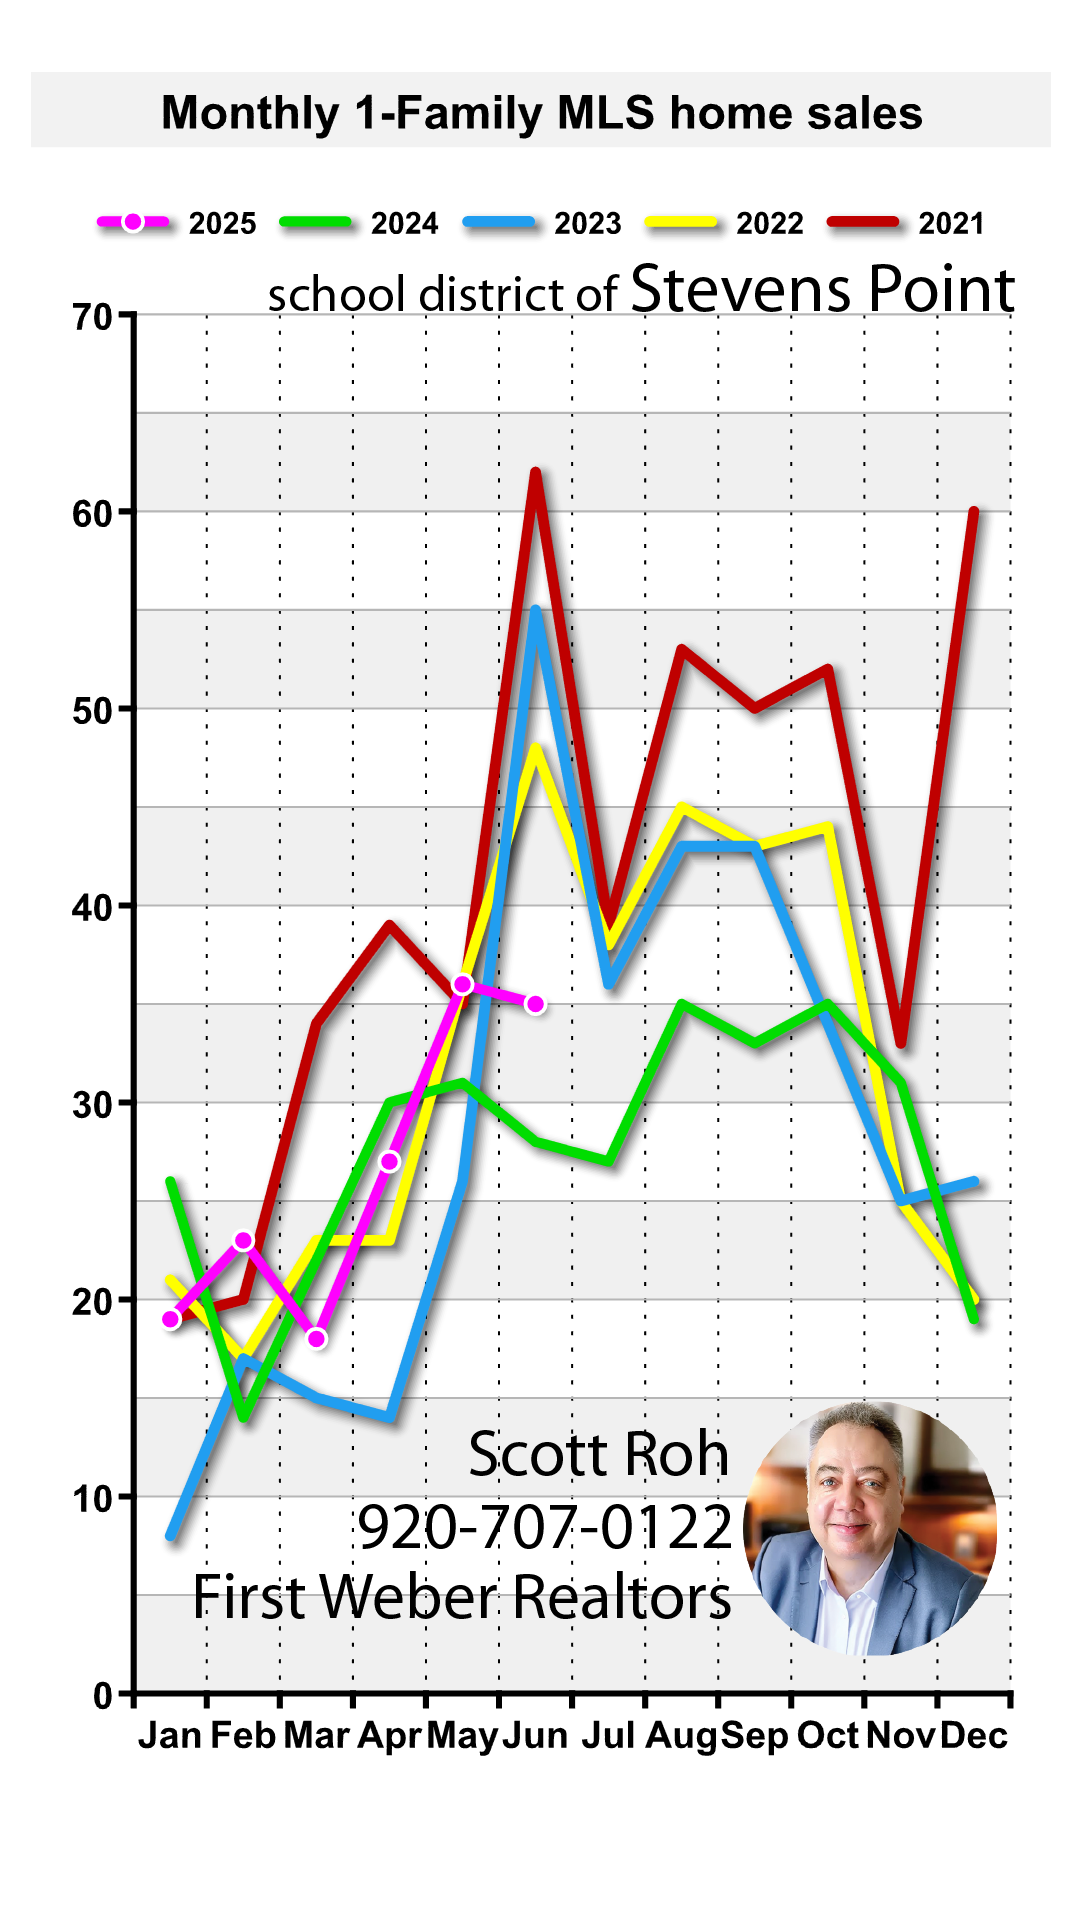
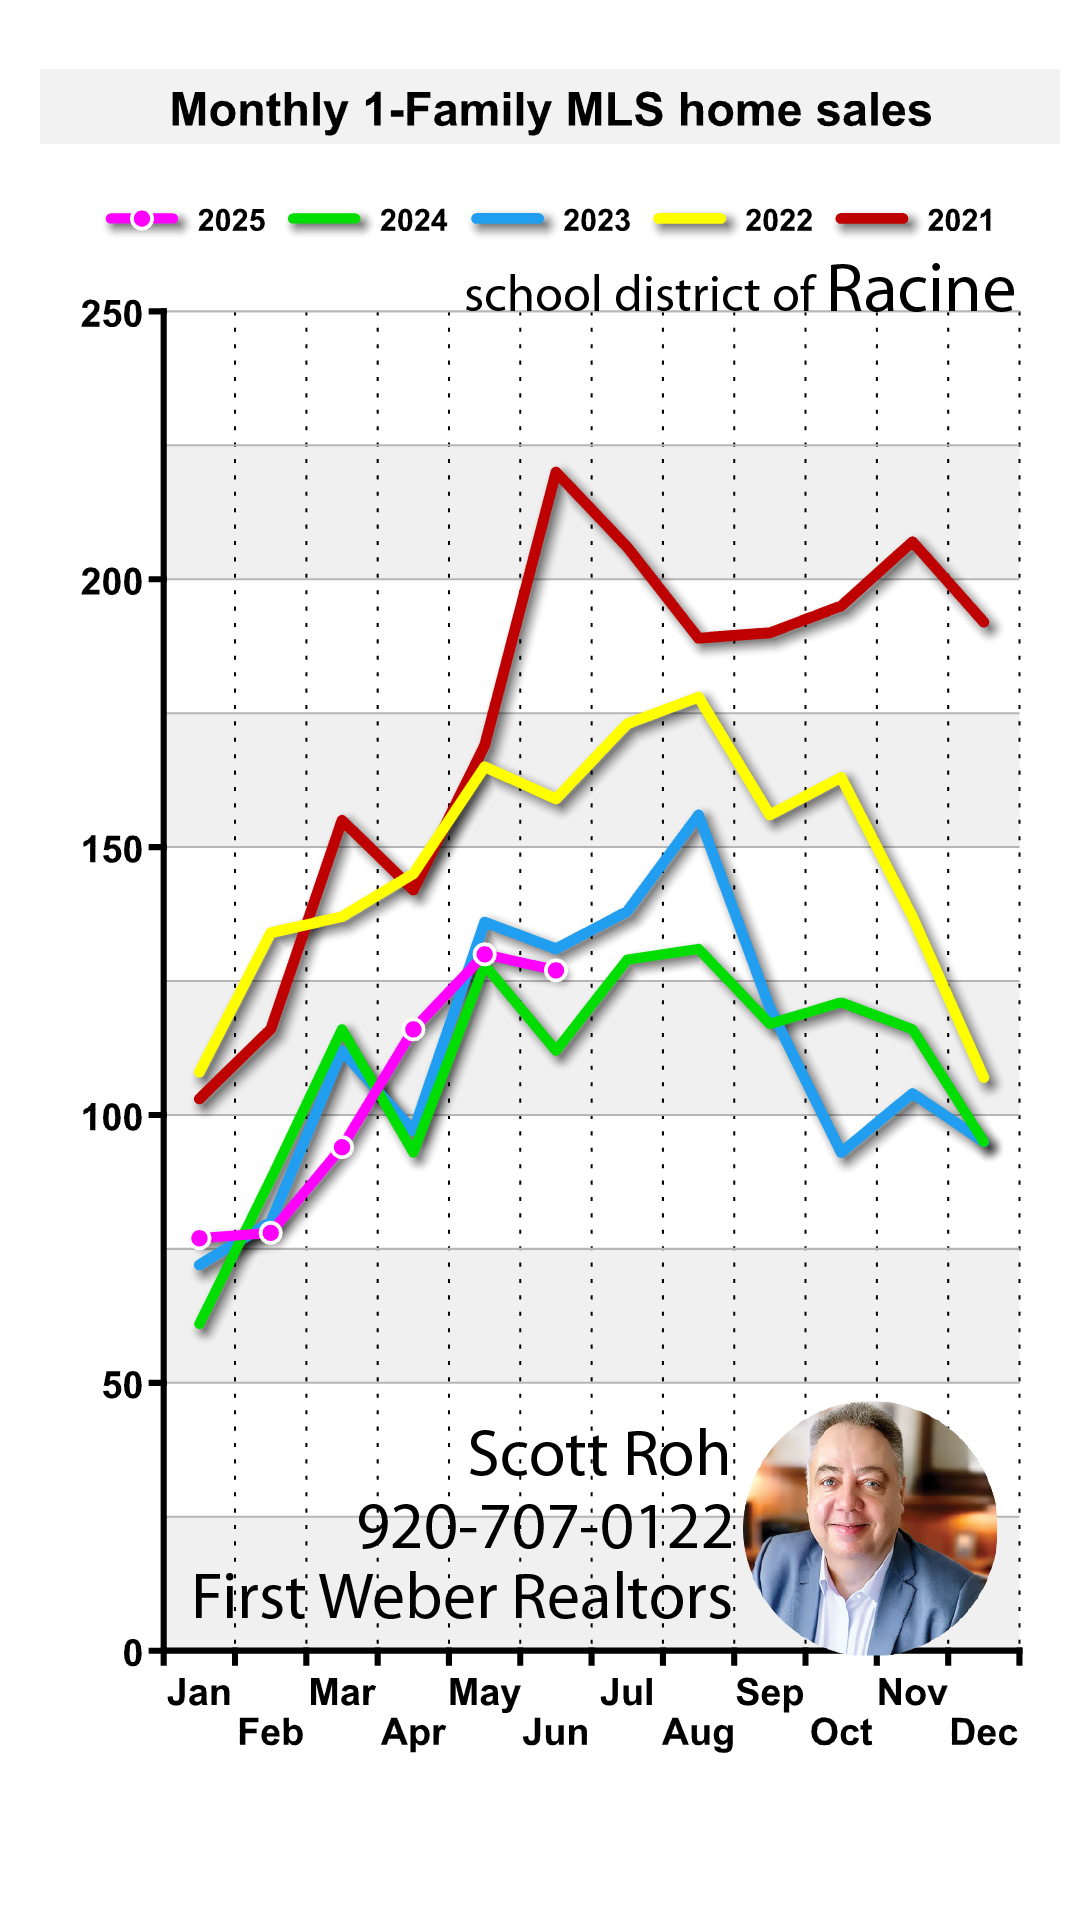
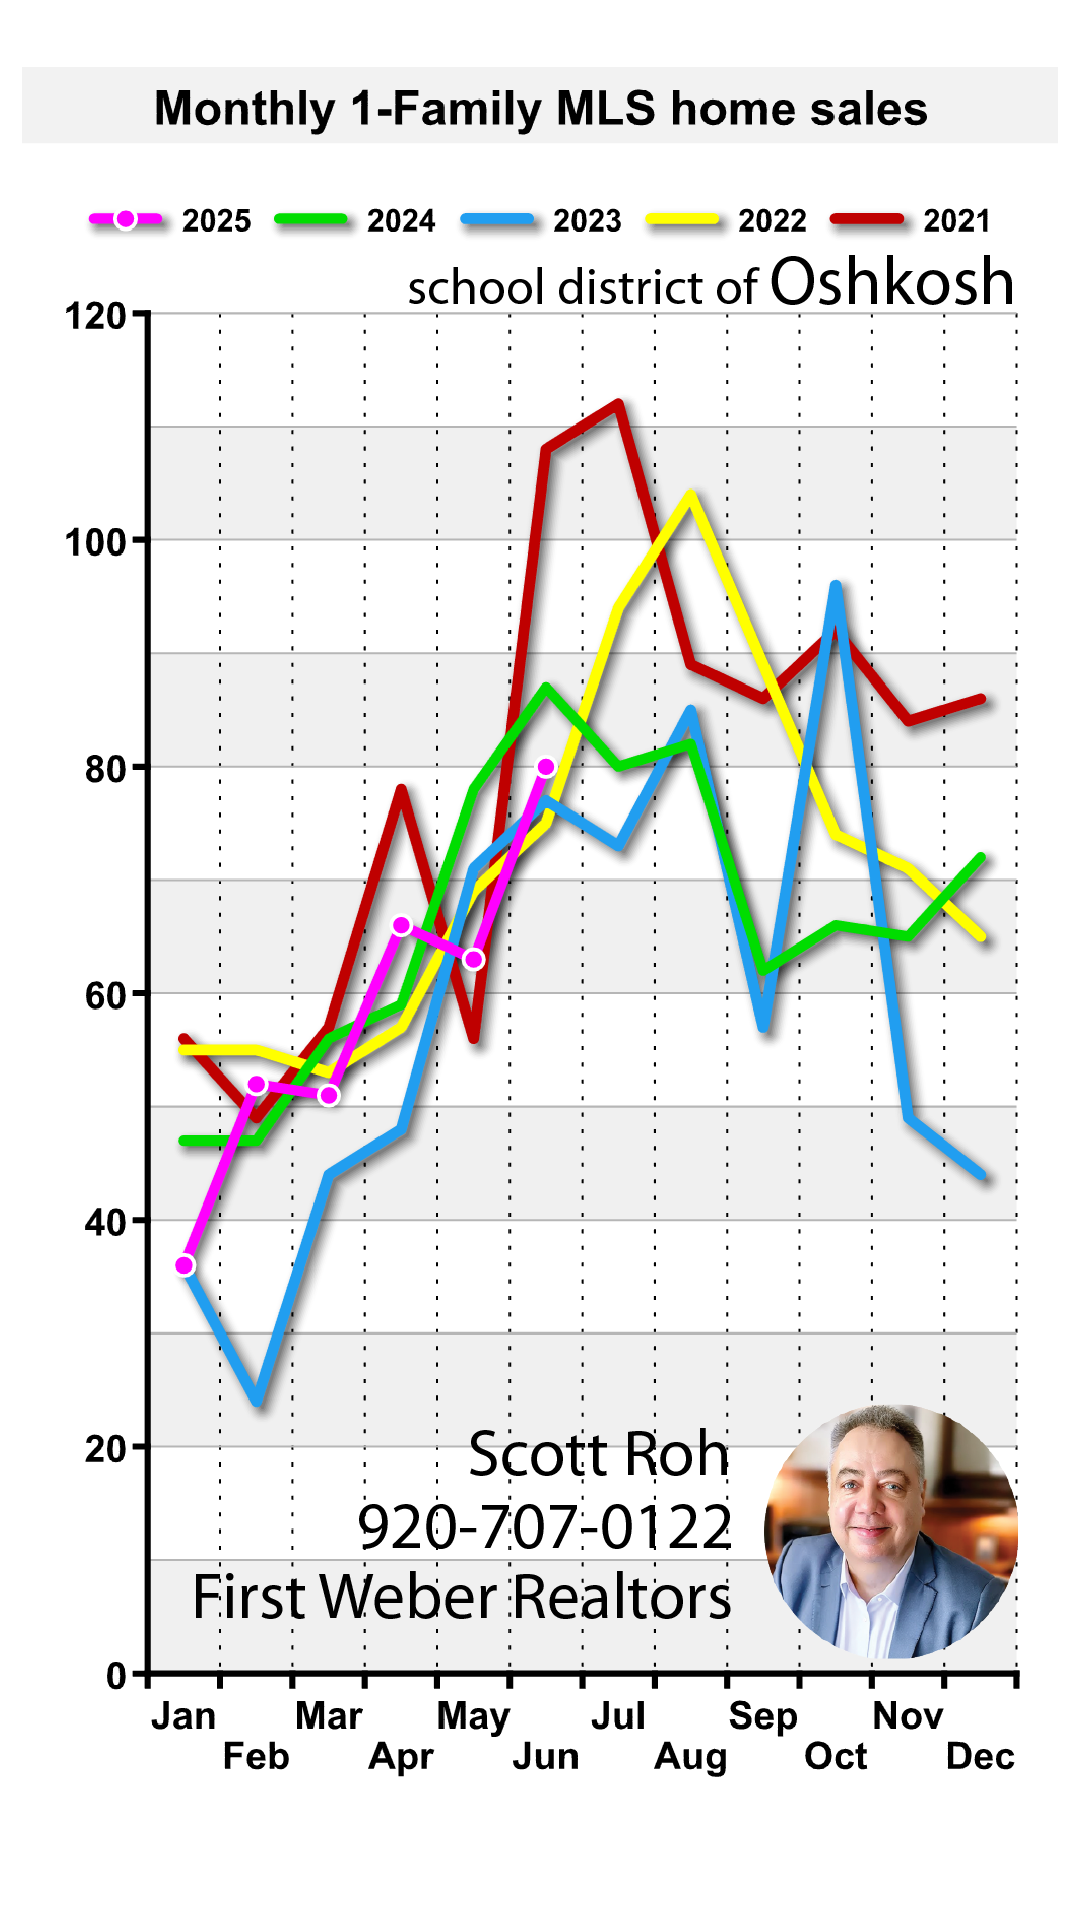
Sampling of data below - click to enlarge
Milwaukee
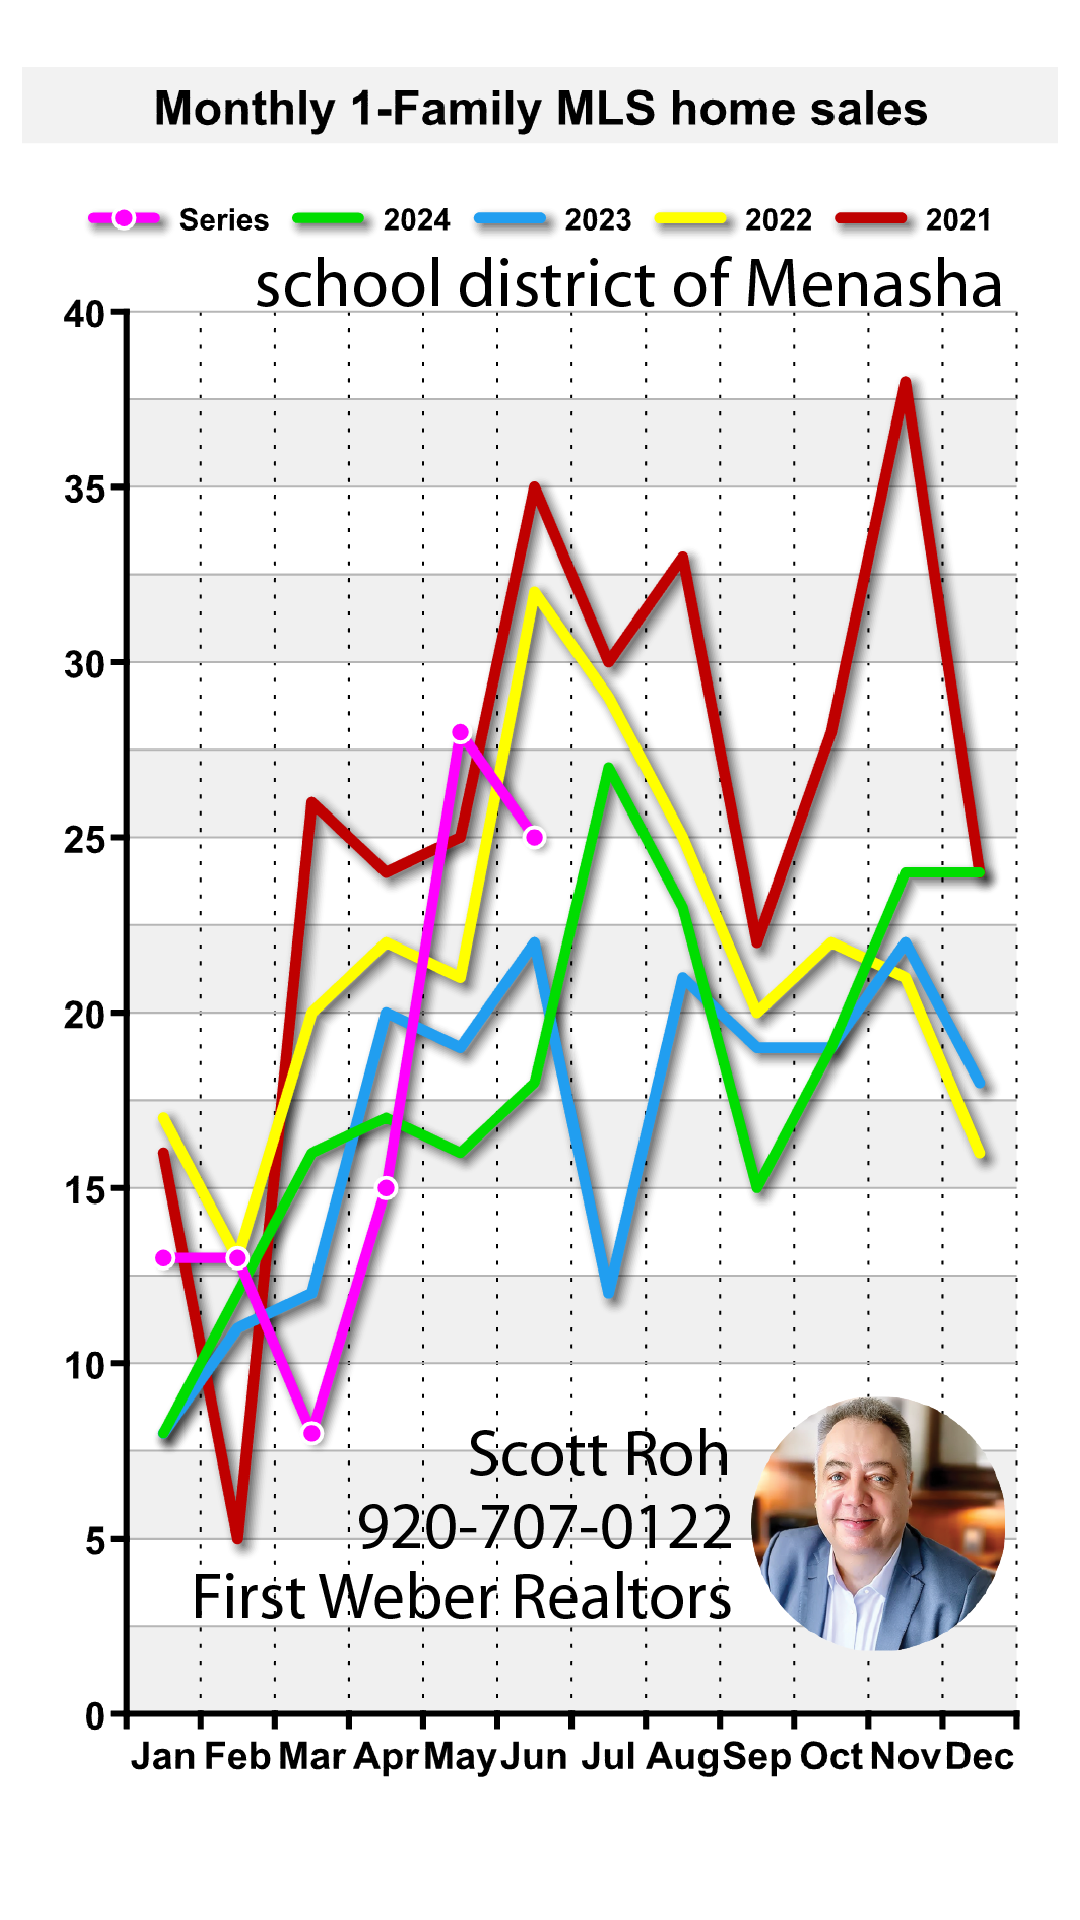
Mobile-Menasha-01 updated with June 2025 home sales data
Green Bay School District updated with June 2025 home sales data
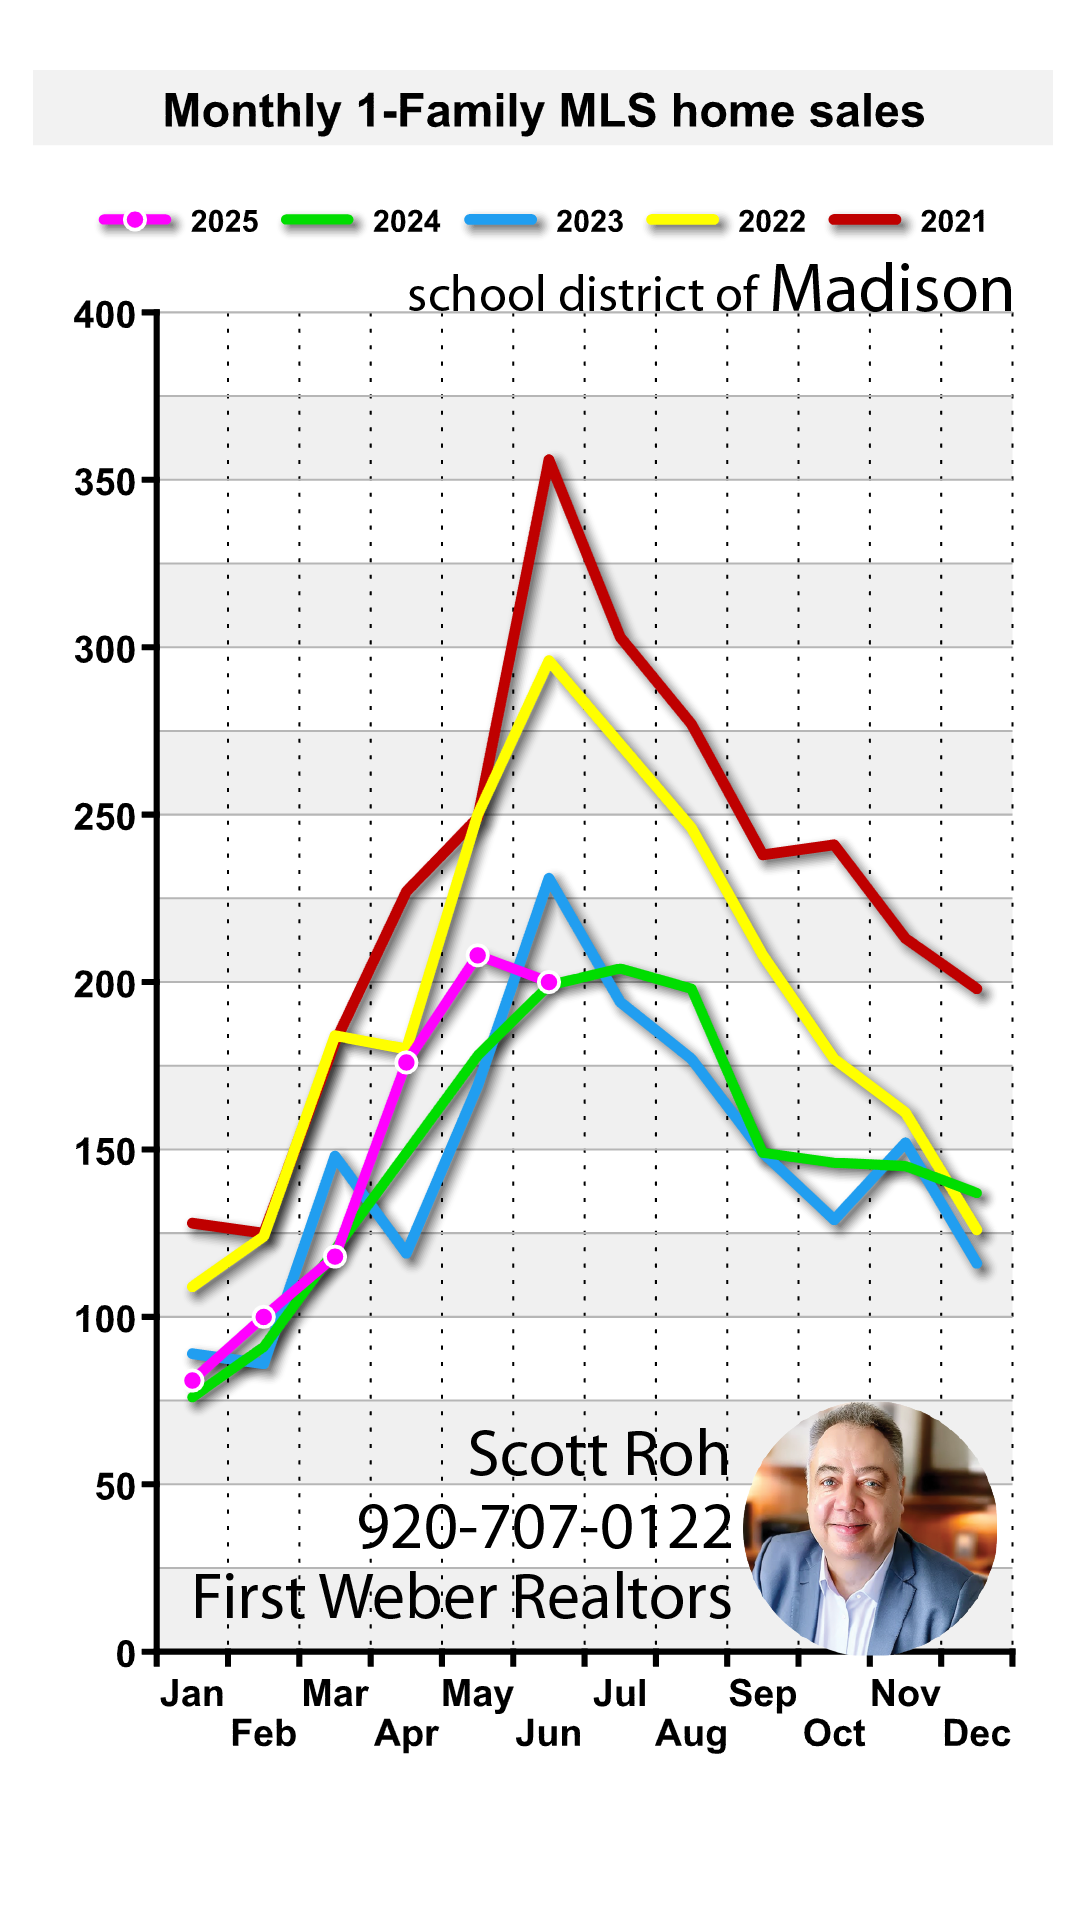
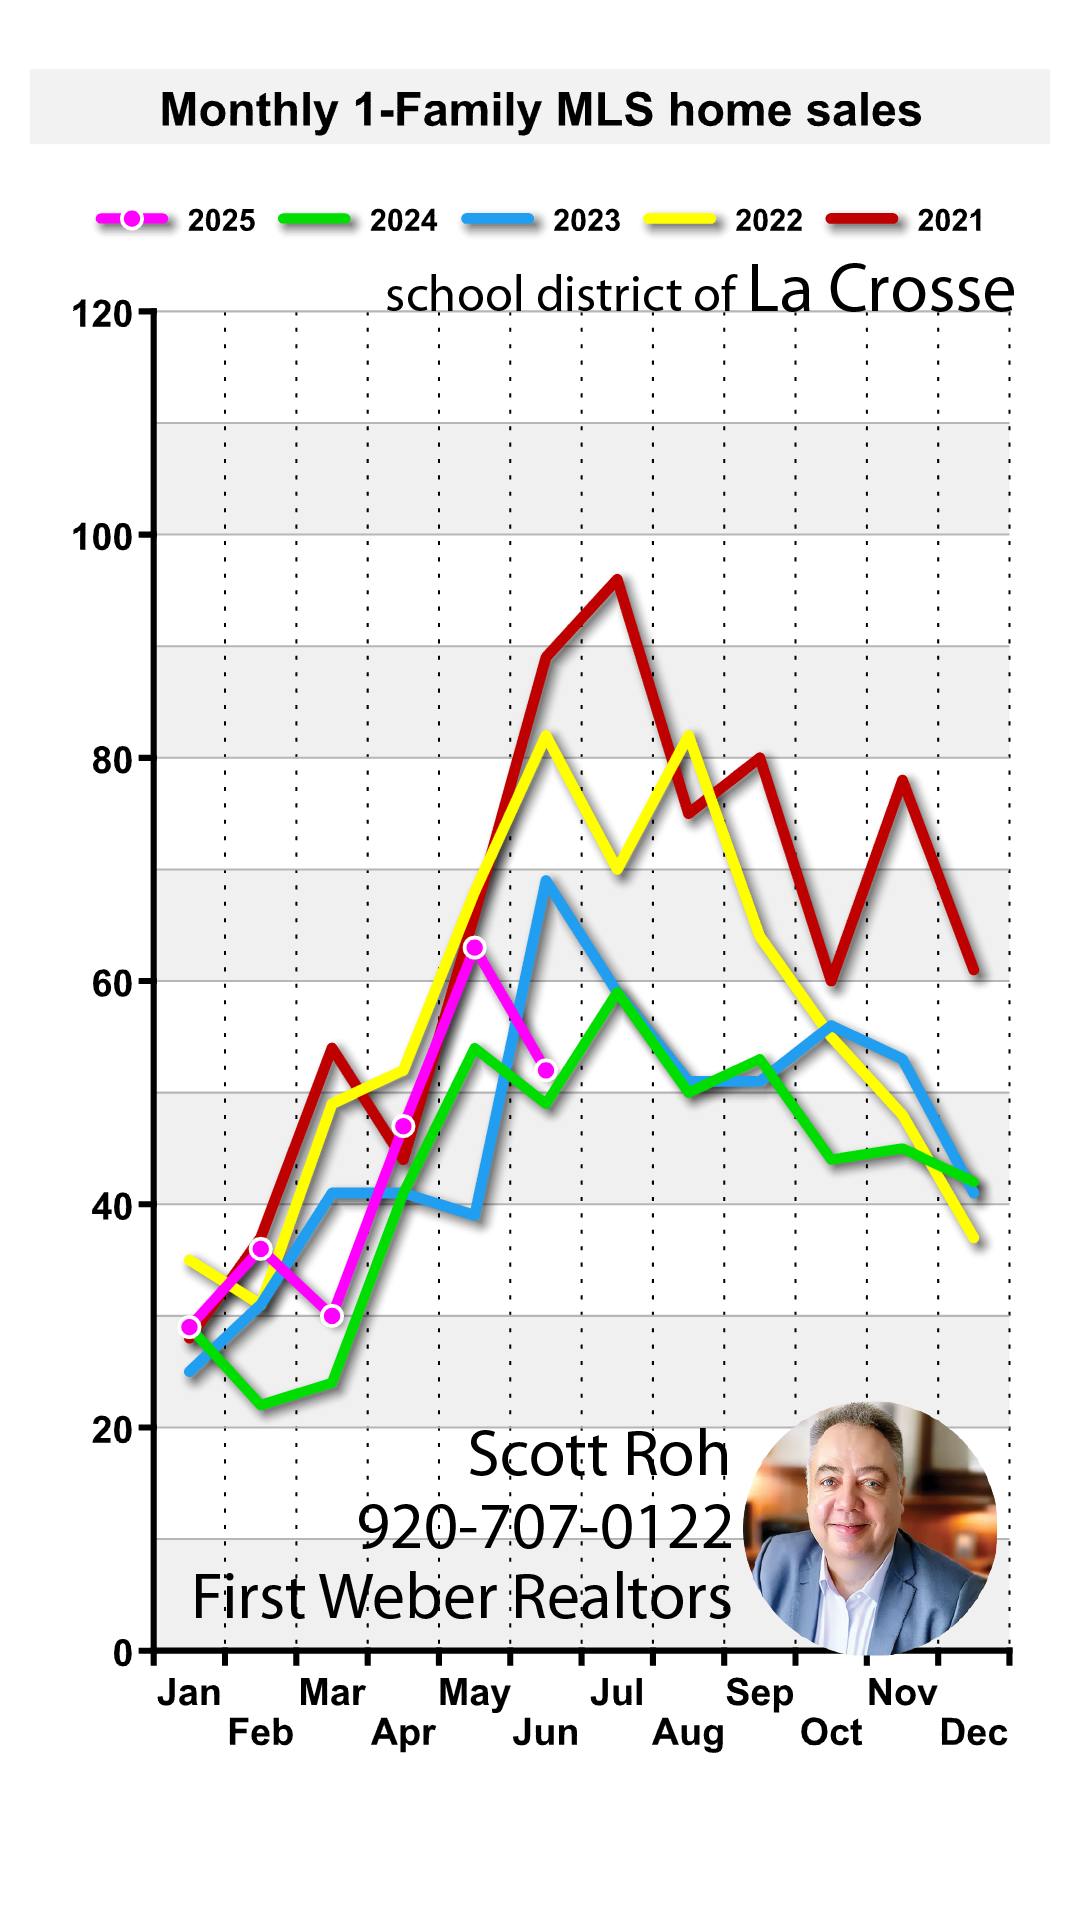
School District updated with June 2025 home sales data
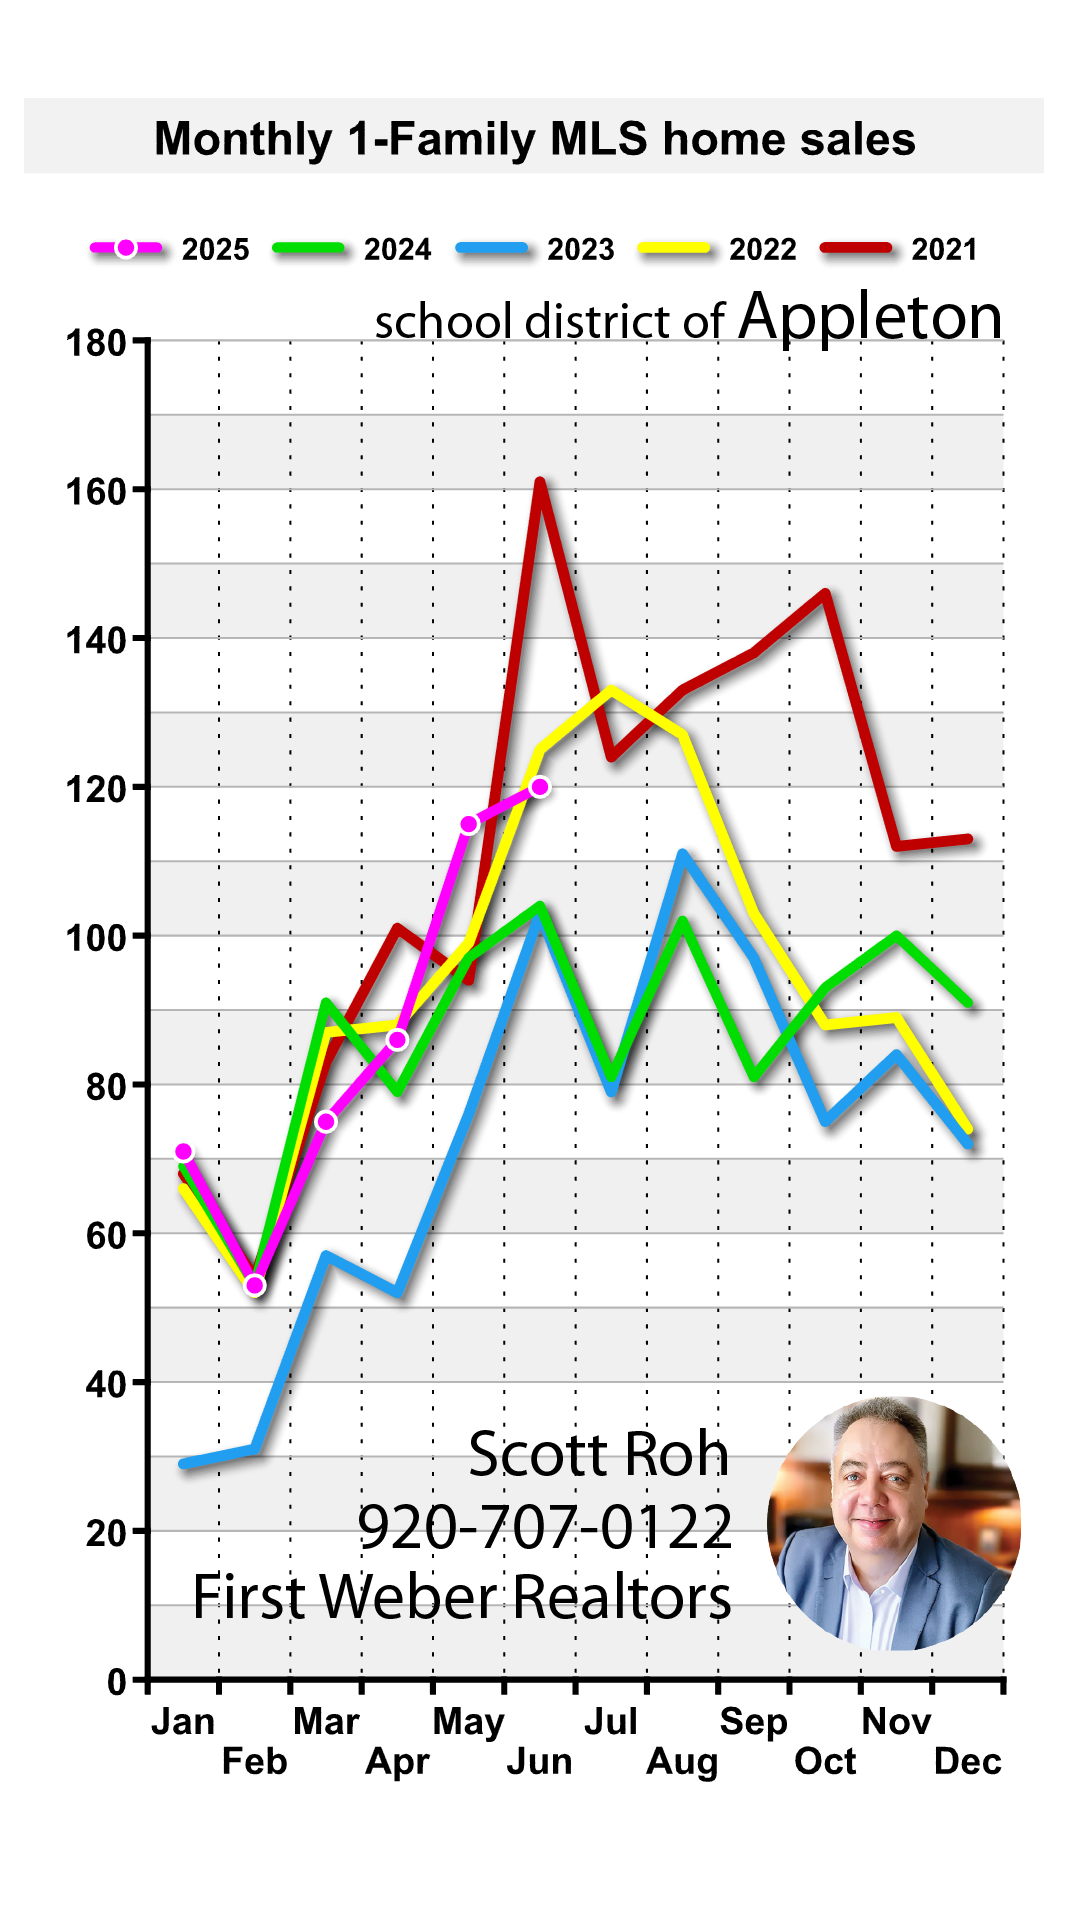
Updated June 2025 1-Family Appleton School District MLS Home Sales
Mobile-Oshkosh-01 updated with June 2025 home sales data
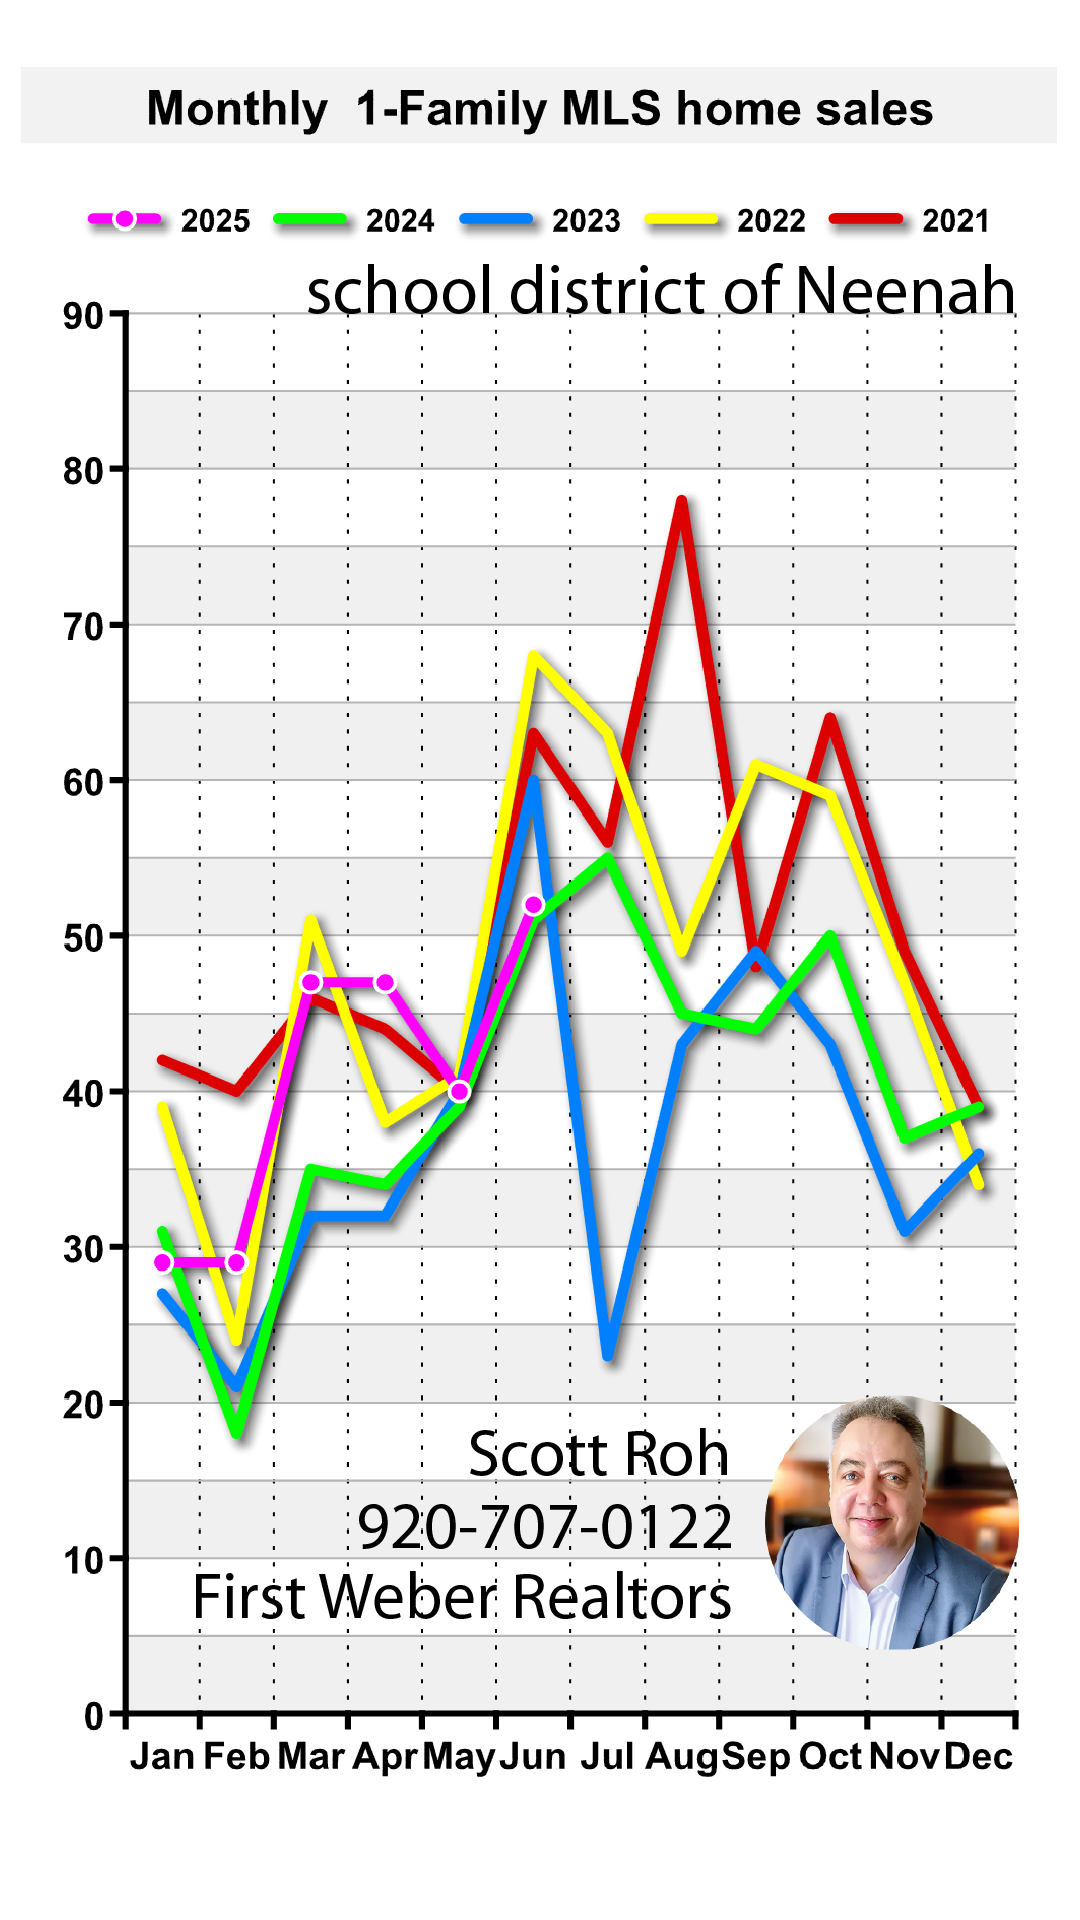
Mobile-Neenah-01 updated with June 2025 home sales data
Flat investment growth chart with real estate-themed background, reflecting U.S. trends since Q1 2023